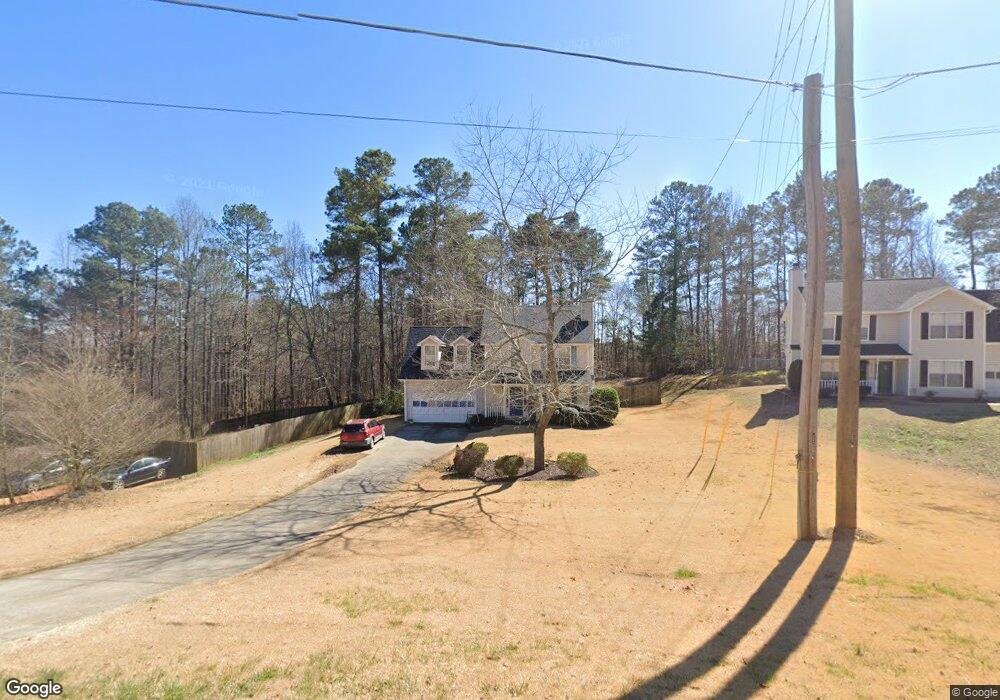
7255 Williams Rd Flowery Branch, GA 30542
Estimated Value: $342,000 - $445,000
3
Beds
3
Baths
1,761
Sq Ft
$213/Sq Ft
Est. Value
About This Home
This home is located at 7255 Williams Rd, Flowery Branch, GA 30542 and is currently estimated at $375,879, approximately $213 per square foot. 7255 Williams Rd is a home located in Hall County with nearby schools including Friendship Elementary School, C.W. Davis Middle School, and Flowery Branch High School.
Ownership History
Date
Name
Owned For
Owner Type
Purchase Details
Closed on
Nov 19, 2018
Sold by
Baines L Neal
Bought by
Baines Lindsey Neal
Current Estimated Value
Home Financials for this Owner
Home Financials are based on the most recent Mortgage that was taken out on this home.
Original Mortgage
$164,266
Outstanding Balance
$143,255
Interest Rate
4.8%
Mortgage Type
FHA
Estimated Equity
$232,624
Purchase Details
Closed on
May 25, 2000
Sold by
Pruitt Jason Kelly and Pruitt Kristen
Bought by
Baines L Neal
Home Financials for this Owner
Home Financials are based on the most recent Mortgage that was taken out on this home.
Original Mortgage
$119,100
Interest Rate
8.14%
Mortgage Type
New Conventional
Purchase Details
Closed on
Dec 18, 1995
Sold by
Hover Homes Inc
Bought by
Pruitt Jason K Kristin
Purchase Details
Closed on
May 1, 1995
Create a Home Valuation Report for This Property
The Home Valuation Report is an in-depth analysis detailing your home's value as well as a comparison with similar homes in the area
Home Values in the Area
Average Home Value in this Area
Purchase History
| Date | Buyer | Sale Price | Title Company |
|---|---|---|---|
| Baines Lindsey Neal | -- | -- | |
| Baines L Neal | $125,400 | -- | |
| Pruitt Jason K Kristin | $89,400 | -- | |
| -- | $32,000 | -- |
Source: Public Records
Mortgage History
| Date | Status | Borrower | Loan Amount |
|---|---|---|---|
| Open | Baines Lindsey Neal | $164,266 | |
| Previous Owner | Baines L Neal | $119,100 | |
| Closed | Pruitt Jason K Kristin | $0 |
Source: Public Records
Tax History Compared to Growth
Tax History
| Year | Tax Paid | Tax Assessment Tax Assessment Total Assessment is a certain percentage of the fair market value that is determined by local assessors to be the total taxable value of land and additions on the property. | Land | Improvement |
|---|---|---|---|---|
| 2024 | $2,935 | $115,920 | $25,520 | $90,400 |
| 2023 | $3,092 | $122,280 | $25,520 | $96,760 |
| 2022 | $2,685 | $101,480 | $28,640 | $72,840 |
| 2021 | $2,388 | $88,240 | $17,720 | $70,520 |
| 2020 | $2,321 | $83,200 | $17,720 | $65,480 |
| 2019 | $2,135 | $75,640 | $8,960 | $66,680 |
| 2018 | $2,223 | $76,320 | $9,800 | $66,520 |
| 2017 | $1,660 | $56,920 | $9,800 | $47,120 |
| 2016 | $1,621 | $56,920 | $9,800 | $47,120 |
| 2015 | $1,691 | $59,000 | $8,160 | $50,840 |
| 2014 | $1,691 | $59,000 | $8,160 | $50,840 |
Source: Public Records
Map
Nearby Homes
- 7464 Williams Rd
- 7272 Coral Lake Dr
- 7343 Peacebrook Dr
- 7235 Coral Lake Dr
- 7293 Litany Ct Unit 49
- 7293 Litany Ct
- 6311 Bent Oaks Ct
- 6707 Spring Head Dr
- 7282 Litany Ct
- 2228 Mayors Way
- 7012 Litany Ct
- 7005 Litany Ct
- 6739 Spring Head Dr
- 6345 Aarons Way
- 7144 Maple Brook Ln
- 2638 Democracy Dr Unit 1
- 7164 Maple Brook Ln
- 6985 Spout Springs Rd
- 7259 Williams Rd
- 7251 Williams Rd
- 7263 Williams Rd
- 0 Williams Rd Unit 7117668
- 0 Williams Rd Unit 7163076
- 0 Williams Rd Unit 3188961
- 0 Williams Rd Unit 8483686
- 0 Williams Rd Unit 7185648
- 0 Williams Rd Unit 7144116
- 0 Williams Rd Unit 8770387
- 0 Williams Rd Unit 8768605
- 0 Williams Rd Unit 8773351
- 0 Williams Rd Unit 8536783
- 0 Williams Rd Unit 8421719
- 0 Williams Rd Unit 8341637
- 0 Williams Rd Unit 8259779
- 0 Williams Rd Unit 8121062
- 0 Williams Rd Unit 7586810
- 0 Williams Rd Unit 7317787
- 0 Williams Rd Unit 7313057