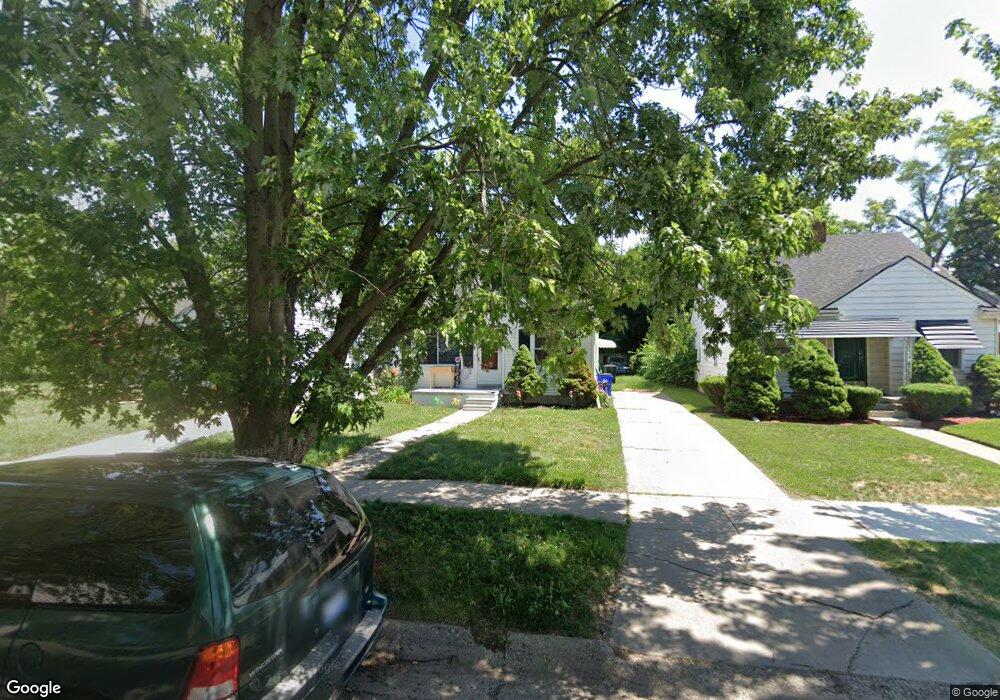
7256 Dacosta Unit Bldg-Unit Redford, MI 48239
Far West Detroit NeighborhoodEstimated Value: $115,000 - $140,000
--
Bed
1
Bath
979
Sq Ft
$133/Sq Ft
Est. Value
About This Home
This home is located at 7256 Dacosta Unit Bldg-Unit, Redford, MI 48239 and is currently estimated at $129,968, approximately $132 per square foot. 7256 Dacosta Unit Bldg-Unit is a home located in Wayne County with nearby schools including Ann Arbor Trail Magnet School, Charles L. Spain Elementary-Middle School, and Edward 'Duke' Ellington Conservatory of Music and Art.
Ownership History
Date
Name
Owned For
Owner Type
Purchase Details
Closed on
Sep 3, 2024
Sold by
Al-Shaheen Mohammed and Al-Shaheen Mohammed Nihad
Bought by
Tindle Moyna G
Current Estimated Value
Home Financials for this Owner
Home Financials are based on the most recent Mortgage that was taken out on this home.
Original Mortgage
$25,000
Outstanding Balance
$24,735
Interest Rate
6.78%
Estimated Equity
$105,233
Purchase Details
Closed on
May 2, 2019
Sold by
Shihab Shaymaa
Bought by
Al Shaheen Mohammed Nihad
Purchase Details
Closed on
Dec 26, 2017
Sold by
Tg Homes Llc
Bought by
Shihab Shaymaa
Purchase Details
Closed on
Nov 30, 2017
Sold by
Rutter Paula Rae and Rutter Jennie K
Bought by
T G Homes Llc
Purchase Details
Closed on
Mar 11, 1999
Sold by
Clemak Sophie
Bought by
Rutter Jennie K
Create a Home Valuation Report for This Property
The Home Valuation Report is an in-depth analysis detailing your home's value as well as a comparison with similar homes in the area
Home Values in the Area
Average Home Value in this Area
Purchase History
| Date | Buyer | Sale Price | Title Company |
|---|---|---|---|
| Tindle Moyna G | $132,000 | None Listed On Document | |
| Al Shaheen Mohammed Nihad | -- | None Available | |
| Shihab Shaymaa | $20,000 | Liberty Title | |
| T G Homes Llc | $8,500 | Liberty Title | |
| Rutter Jennie K | -- | -- |
Source: Public Records
Mortgage History
| Date | Status | Borrower | Loan Amount |
|---|---|---|---|
| Open | Tindle Moyna G | $25,000 | |
| Open | Tindle Moyna G | $88,200 |
Source: Public Records
Tax History Compared to Growth
Tax History
| Year | Tax Paid | Tax Assessment Tax Assessment Total Assessment is a certain percentage of the fair market value that is determined by local assessors to be the total taxable value of land and additions on the property. | Land | Improvement |
|---|---|---|---|---|
| 2025 | $1,548 | $48,800 | $0 | $0 |
| 2024 | $1,548 | $40,900 | $0 | $0 |
| 2023 | $1,503 | $33,100 | $0 | $0 |
| 2022 | $1,606 | $28,000 | $0 | $0 |
| 2021 | $1,561 | $22,600 | $0 | $0 |
| 2020 | $1,560 | $19,600 | $0 | $0 |
| 2019 | $1,536 | $17,200 | $0 | $0 |
| 2018 | $1,341 | $14,300 | $0 | $0 |
| 2017 | $239 | $13,100 | $0 | $0 |
| 2016 | $1,125 | $14,700 | $0 | $0 |
| 2015 | $1,470 | $14,700 | $0 | $0 |
| 2013 | $2,359 | $23,594 | $0 | $0 |
| 2010 | -- | $34,593 | $915 | $33,678 |
Source: Public Records
Map
Nearby Homes