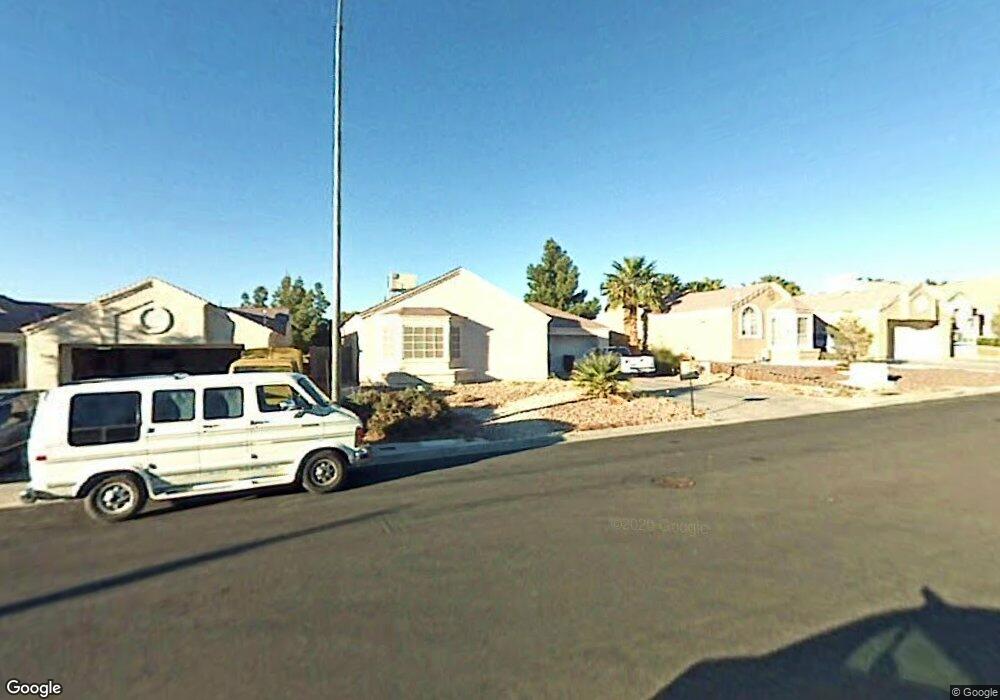
7256 Wycliff Ln Las Vegas, NV 89156
Estimated Value: $354,857 - $410,000
3
Beds
2
Baths
1,172
Sq Ft
$321/Sq Ft
Est. Value
About This Home
This home is located at 7256 Wycliff Ln, Las Vegas, NV 89156 and is currently estimated at $376,214, approximately $321 per square foot. 7256 Wycliff Ln is a home located in Clark County with nearby schools including Liliam Lujan Hickey Elementary School, Dr. William H. Bailey Middle School, and Sunrise Mountain High School.
Ownership History
Date
Name
Owned For
Owner Type
Purchase Details
Closed on
Dec 22, 1998
Sold by
Boyden James L and Boyden Junette
Bought by
Boyden James L and Boyden Junette
Current Estimated Value
Home Financials for this Owner
Home Financials are based on the most recent Mortgage that was taken out on this home.
Original Mortgage
$108,998
Interest Rate
6.91%
Mortgage Type
FHA
Purchase Details
Closed on
Oct 21, 1996
Sold by
Hutchinson Patricia L
Bought by
Boyden James L and Boyden Junette B
Home Financials for this Owner
Home Financials are based on the most recent Mortgage that was taken out on this home.
Original Mortgage
$110,339
Interest Rate
8.11%
Mortgage Type
FHA
Create a Home Valuation Report for This Property
The Home Valuation Report is an in-depth analysis detailing your home's value as well as a comparison with similar homes in the area
Home Values in the Area
Average Home Value in this Area
Purchase History
| Date | Buyer | Sale Price | Title Company |
|---|---|---|---|
| Boyden James L | -- | Nevada Title Company | |
| Boyden James L | $112,500 | First American Title Co |
Source: Public Records
Mortgage History
| Date | Status | Borrower | Loan Amount |
|---|---|---|---|
| Previous Owner | Boyden James L | $108,998 | |
| Previous Owner | Boyden James L | $110,339 |
Source: Public Records
Tax History Compared to Growth
Tax History
| Year | Tax Paid | Tax Assessment Tax Assessment Total Assessment is a certain percentage of the fair market value that is determined by local assessors to be the total taxable value of land and additions on the property. | Land | Improvement |
|---|---|---|---|---|
| 2025 | $927 | $65,590 | $27,650 | $37,940 |
| 2024 | $901 | $65,590 | $27,650 | $37,940 |
| 2023 | $901 | $65,492 | $29,050 | $36,442 |
| 2022 | $875 | $57,079 | $23,450 | $33,629 |
| 2021 | $849 | $52,821 | $21,700 | $31,121 |
| 2020 | $791 | $50,359 | $19,250 | $31,109 |
| 2019 | $768 | $46,549 | $15,750 | $30,799 |
| 2018 | $745 | $43,535 | $13,650 | $29,885 |
| 2017 | $1,263 | $43,078 | $12,600 | $30,478 |
| 2016 | $707 | $40,313 | $9,450 | $30,863 |
| 2015 | $704 | $30,833 | $6,300 | $24,533 |
| 2014 | $684 | $22,618 | $6,300 | $16,318 |
Source: Public Records
Map
Nearby Homes
- 2236 Welsey Manor Dr
- 7253 Alsop Ct
- 2110 Los Feliz St Unit 2037
- 2110 Los Feliz St Unit 2069
- 2110 Los Feliz St Unit 2091
- 2110 Los Feliz St Unit 1096
- 2110 Los Feliz St Unit 1034
- 2110 Los Feliz St Unit 1066
- 2110 Los Feliz St Unit 2064
- 2281 Los Feliz St
- 7090 Burcot Ave Unit B32
- 7054 Burcot Ave Unit 40
- 7055 Canary Ivy Way
- 2170 Dragon Claw Ln
- 7040 Canary Ivy Way
- 2362 Sierra Sunrise St
- 7198 Pascal Dr
- 2311 Sierra Sunrise St
- 2337 Sierra Sunrise St
- 6955 Appleton Dr
- 7264 Wycliff Ln
- 7248 Wycliff Ln
- 7247 Laveta Ln
- 7239 Laveta Ln
- 7272 Wycliff Ln
- 7240 Wycliff Ln
- 7255 Laveta Ln
- 2242 Granby Ct
- 2241 Granby Ct
- 7233 Laveta Ln
- 7280 Wycliff Ln
- 7232 Wycliff Ln Unit 9B
- 7263 Laveta Ln
- 2240 Ambleside Ct
- 2243 Welsey Manor Dr
- 2233 Granby Ct
- 2234 Granby Ct
- 7225 Laveta Ln Unit 9B
- 7224 Wycliff Ln
- 7240 Laveta Ln