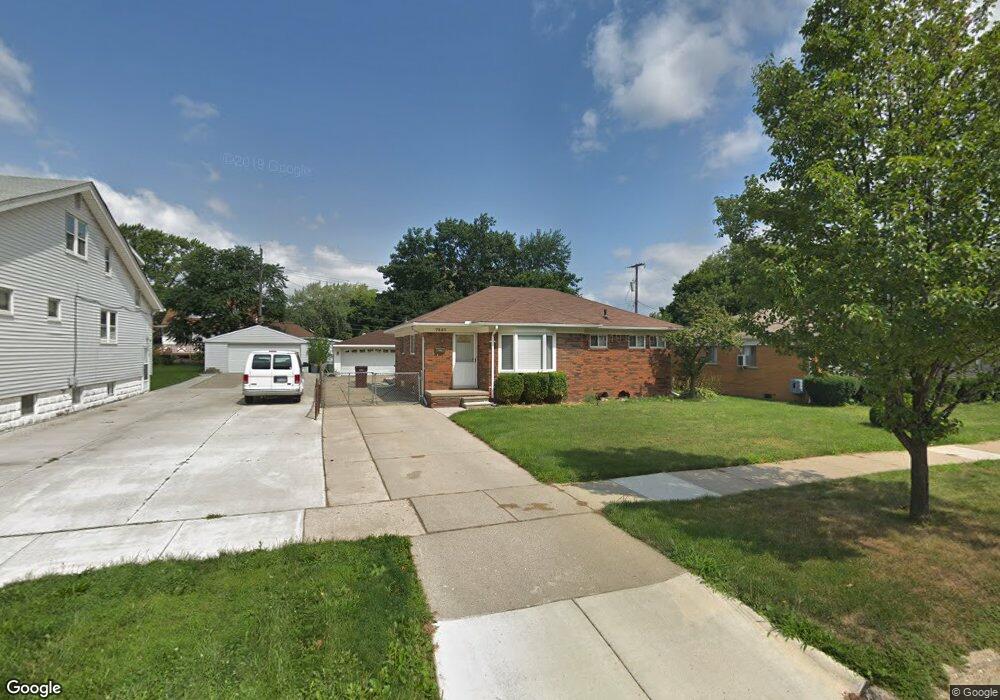
7257 Wiegand Center Line, MI 48015
Estimated Value: $146,000 - $198,172
3
Beds
1
Bath
1,047
Sq Ft
$174/Sq Ft
Est. Value
About This Home
This home is located at 7257 Wiegand, Center Line, MI 48015 and is currently estimated at $182,293, approximately $174 per square foot. 7257 Wiegand is a home located in Macomb County with nearby schools including Crothers Elementary School, Center Line High School, and Wolfe Middle School.
Ownership History
Date
Name
Owned For
Owner Type
Purchase Details
Closed on
Jul 9, 2009
Sold by
Donovan Shaun
Bought by
Lee Samantha
Current Estimated Value
Purchase Details
Closed on
Apr 30, 2008
Sold by
Countrywide Home Loans Inc
Bought by
Hud
Purchase Details
Closed on
Apr 22, 2008
Sold by
Mortgage Electronic Registration Systems
Bought by
Countrywide Home Loans Inc
Purchase Details
Closed on
Oct 12, 2007
Sold by
Orwig Kristy M and Orwig David F
Bought by
Mortgage Electronic Registration Systems
Purchase Details
Closed on
Oct 4, 1996
Sold by
Radyko J
Bought by
Silkwood D and Silkwood C
Create a Home Valuation Report for This Property
The Home Valuation Report is an in-depth analysis detailing your home's value as well as a comparison with similar homes in the area
Home Values in the Area
Average Home Value in this Area
Purchase History
| Date | Buyer | Sale Price | Title Company |
|---|---|---|---|
| Lee Samantha | $46,100 | None Available | |
| Hud | -- | None Available | |
| Countrywide Home Loans Inc | -- | None Available | |
| Mortgage Electronic Registration Systems | $169,553 | None Available | |
| Silkwood D | $83,888 | -- |
Source: Public Records
Tax History Compared to Growth
Tax History
| Year | Tax Paid | Tax Assessment Tax Assessment Total Assessment is a certain percentage of the fair market value that is determined by local assessors to be the total taxable value of land and additions on the property. | Land | Improvement |
|---|---|---|---|---|
| 2025 | $2,722 | $90,300 | $0 | $0 |
| 2024 | $2,150 | $83,200 | $0 | $0 |
| 2023 | $2,074 | $73,800 | $0 | $0 |
| 2022 | $2,570 | $66,700 | $0 | $0 |
| 2021 | $2,675 | $61,700 | $0 | $0 |
| 2020 | $2,182 | $57,700 | $0 | $0 |
| 2019 | $2,789 | $47,400 | $0 | $0 |
| 2018 | $0 | $42,730 | $0 | $0 |
| 2017 | $2,558 | $39,970 | $7,050 | $32,920 |
| 2016 | $2,553 | $39,970 | $0 | $0 |
| 2015 | -- | $37,440 | $0 | $0 |
| 2011 | -- | $40,700 | $5,520 | $35,180 |
Source: Public Records
Map
Nearby Homes