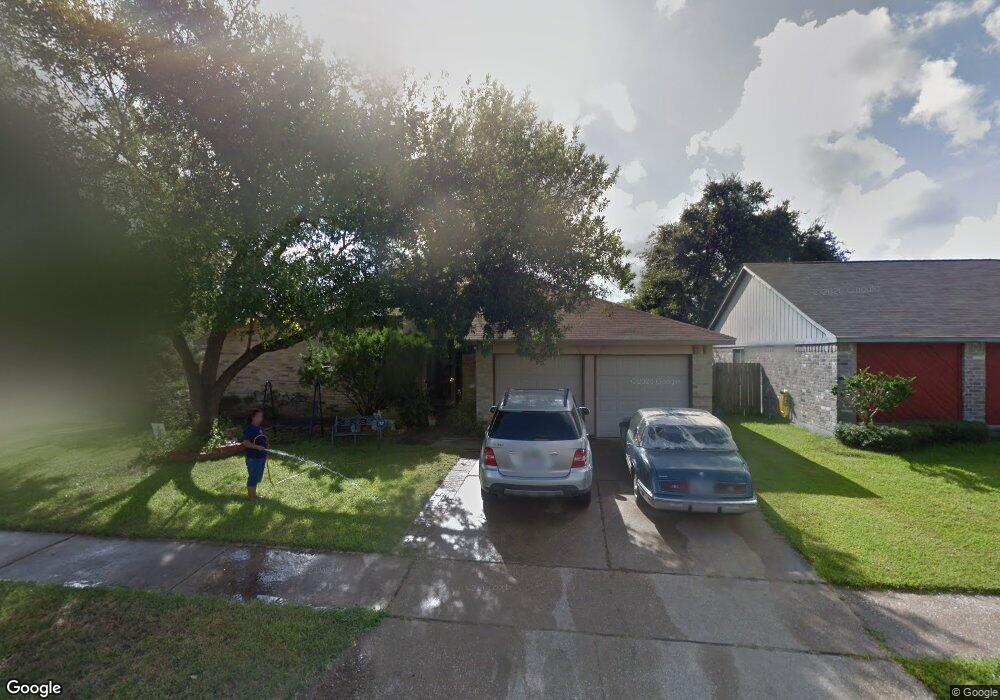
7258 Sonnet Glen Ln Houston, TX 77095
Copperfield NeighborhoodEstimated Value: $235,444 - $259,000
3
Beds
2
Baths
1,510
Sq Ft
$162/Sq Ft
Est. Value
About This Home
This home is located at 7258 Sonnet Glen Ln, Houston, TX 77095 and is currently estimated at $244,611, approximately $161 per square foot. 7258 Sonnet Glen Ln is a home located in Harris County with nearby schools including Holmsley Elementary School, Aragon Middle School, and Langham Creek High School.
Ownership History
Date
Name
Owned For
Owner Type
Purchase Details
Closed on
Sep 24, 2019
Sold by
Perez Jorge and Perez Maria
Bought by
Perez Jorge Enrique and Perez Maria Del Rosario Suarez De
Current Estimated Value
Home Financials for this Owner
Home Financials are based on the most recent Mortgage that was taken out on this home.
Original Mortgage
$88,350
Outstanding Balance
$77,388
Interest Rate
3.6%
Mortgage Type
Seller Take Back
Estimated Equity
$167,223
Purchase Details
Closed on
Feb 21, 2003
Sold by
Harris Ronnie W
Bought by
Perez Jorge
Home Financials for this Owner
Home Financials are based on the most recent Mortgage that was taken out on this home.
Original Mortgage
$88,350
Interest Rate
5.93%
Purchase Details
Closed on
Apr 28, 1994
Sold by
Elkins Michael D and Elkins Debra K
Bought by
Harris Ronnie W
Create a Home Valuation Report for This Property
The Home Valuation Report is an in-depth analysis detailing your home's value as well as a comparison with similar homes in the area
Home Values in the Area
Average Home Value in this Area
Purchase History
| Date | Buyer | Sale Price | Title Company |
|---|---|---|---|
| Perez Jorge Enrique | -- | None Available | |
| Perez Jorge | -- | -- | |
| Harris Ronnie W | -- | -- |
Source: Public Records
Mortgage History
| Date | Status | Borrower | Loan Amount |
|---|---|---|---|
| Open | Perez Jorge Enrique | $88,350 | |
| Closed | Perez Jorge | $88,350 |
Source: Public Records
Tax History Compared to Growth
Tax History
| Year | Tax Paid | Tax Assessment Tax Assessment Total Assessment is a certain percentage of the fair market value that is determined by local assessors to be the total taxable value of land and additions on the property. | Land | Improvement |
|---|---|---|---|---|
| 2025 | $1,454 | $258,800 | $49,193 | $209,607 |
| 2024 | $1,454 | $212,000 | $49,193 | $162,807 |
| 2023 | $1,454 | $259,372 | $49,193 | $210,179 |
| 2022 | $4,405 | $202,708 | $40,941 | $161,767 |
| 2021 | $4,432 | $170,741 | $40,941 | $129,800 |
| 2020 | $3,949 | $146,023 | $31,420 | $114,603 |
| 2019 | $3,625 | $139,922 | $23,486 | $116,436 |
| 2018 | $272 | $129,314 | $23,486 | $105,828 |
| 2017 | $3,105 | $125,868 | $23,486 | $102,382 |
| 2016 | $2,823 | $119,686 | $23,486 | $96,200 |
| 2015 | $774 | $108,481 | $15,551 | $92,930 |
| 2014 | $774 | $93,920 | $15,551 | $78,369 |
Source: Public Records
Map
Nearby Homes
- 7254 Sonnet Glen Ln
- 7311 Barton Oaks Dr
- 7306 Bubbling Brooks Ln
- 16734 Pebbleglen Dr
- 17015 Sky Blue Place
- 7307 Sunlight Ln
- 16902 Terrace Park Dr
- 17206 Haley Falls Ln
- 16911 Shady Square Ct
- 17230 Valhallah Way
- 7607 Plumtree Forest Cir
- 7215 Daylight Ln
- 17234 Rush Trace Ct
- 17222 Crown Meadow Ct
- 7539 Wildwood Brook Ct
- 16714 Rockbend
- 7519 Sunlight Ln
- 6839 Catarina Cir
- 16606 Cliff Vale Ct
- 16706 Blairstone
- 7243 Gallant Glen Ln
- 7239 Gallant Glen Ln
- 7250 Sonnet Glen Ln
- 7302 Sonnet Glen Ln
- 7259 Sonnet Glen Ln
- 7303 Gallant Glen Ln
- 7235 Gallant Glen Ln
- 7255 Sonnet Glen Ln
- 7246 Sonnet Glen Ln
- 7306 Sonnet Glen Ln
- 7251 Sonnet Glen Ln
- 7303 Sonnet Glen Ln
- 7307 Gallant Glen Ln
- 7231 Gallant Glen Ln
- 7247 Sonnet Glen Ln
- 7307 Sonnet Glen Ln
- 7242 Sonnet Glen Ln
- 7310 Sonnet Glen Ln
- 7242 Gallant Glen Ln
- 7262 Lost Fable Ln