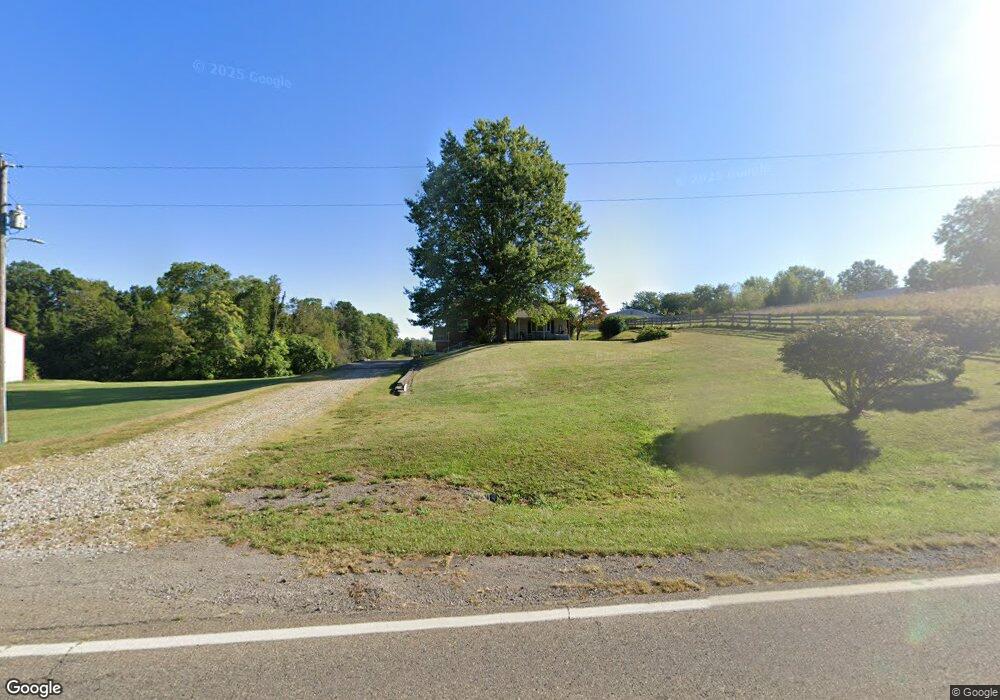
72597 Uniontown Flushing Rd Flushing, OH 43977
Estimated Value: $136,000 - $256,000
3
Beds
3
Baths
1,532
Sq Ft
$119/Sq Ft
Est. Value
About This Home
This home is located at 72597 Uniontown Flushing Rd, Flushing, OH 43977 and is currently estimated at $182,923, approximately $119 per square foot. 72597 Uniontown Flushing Rd is a home located in Belmont County with nearby schools including Union Local Elementary School, Union Local Middle School, and Union Local High School.
Ownership History
Date
Name
Owned For
Owner Type
Purchase Details
Closed on
Aug 4, 2020
Sold by
Crook Eleanor J
Bought by
Crook Keith E
Current Estimated Value
Purchase Details
Closed on
Aug 16, 1994
Sold by
Crook Lawrence D and Crook Eleano
Bought by
Crook Lawrence D and Crook Eleano
Purchase Details
Closed on
Jan 1, 1986
Sold by
Beck Marianne
Bought by
Beck Marianne
Create a Home Valuation Report for This Property
The Home Valuation Report is an in-depth analysis detailing your home's value as well as a comparison with similar homes in the area
Purchase History
We collect this data history from publicly available records. To have your information removed, we recommend requesting removal directly through your county’s website.
| Date | Buyer | Sale Price | Title Company |
|---|---|---|---|
| Crook Keith E | -- | Showcase Title Agency | |
| Crook Lawrence D | $85,000 | -- | |
| Beck Marianne | -- | -- |
Source: Public Records
Tax History
| Year | Tax Paid | Tax Assessment Tax Assessment Total Assessment is a certain percentage of the fair market value that is determined by local assessors to be the total taxable value of land and additions on the property. | Land | Improvement |
|---|---|---|---|---|
| 2025 | $1,124 | $47,170 | $5,750 | $41,420 |
| 2023 | $2,120 | $65,340 | $4,660 | $60,680 |
| 2022 | $2,119 | $65,345 | $4,662 | $60,683 |
| 2021 | $1,781 | $65,355 | $4,662 | $60,693 |
| 2020 | $1,581 | $56,830 | $4,050 | $52,780 |
| 2019 | $1,584 | $56,830 | $4,050 | $52,780 |
| 2018 | $1,538 | $56,830 | $4,050 | $52,780 |
| 2017 | $1,500 | $52,950 | $3,320 | $49,630 |
| 2016 | $1,505 | $52,950 | $3,320 | $49,630 |
| 2015 | $1,553 | $52,950 | $3,320 | $49,630 |
| 2014 | $1,280 | $45,080 | $3,020 | $42,060 |
| 2013 | $1,253 | $45,080 | $3,020 | $42,060 |
Source: Public Records
Map
Nearby Homes
- 71770 Chini Orchard Rd
- 41152 Black Oak Rd
- 117 A&B High St
- 112 W College St
- 70090 Main St
- 19 acres Saffell Rd
- 15 acres Saffell Rd
- 68895 Lloydsville Bannock Rd
- 0 Holloway Rd State Rt 331 Unit 5067951
- 0 Moriah Dr Unit 5177567
- 67174 Pancoast Rd S
- 44701 Springbrook Dr
- INLOT 19 Havenwood
- 40900 Havenwood Dr
- 44290 Denise Ln
- 66700 Pancoast Rd S
- 409 Ashton St
- 125 Chaplins Ln
- 0 Watson Rd Unit 5068291
- 66164 Belmont Morristown Rd
- 72581 Uniontown Flushing Rd
- 72645 Flushing Holloway Rd
- 72659 Uniontown Flushing Rd
- 72510 Uniontown Flushing Rd
- 72227 Barylak Rd
- 72610 Uniontown Flushing Rd
- 72223 Barylak Rd
- 72321 Blair Rd
- 72400 Uniontown Flushing Rd
- 72219 Barylak Rd
- 72684 Uniontown Flushing Rd
- 72380 Blair Rd
- 72215 Barylak Rd
- 72213 Brokaw Rd
- 72037 Barylak Rd
- 42221 Dutton Dr
- 42190 Dutton Dr
- 72761 Uniontown Flushing Rd
- 72395 Uniontown Flushing Rd
- 72781 Uniontown Flushing Rd
Your Personal Tour Guide
Ask me questions while you tour the home.