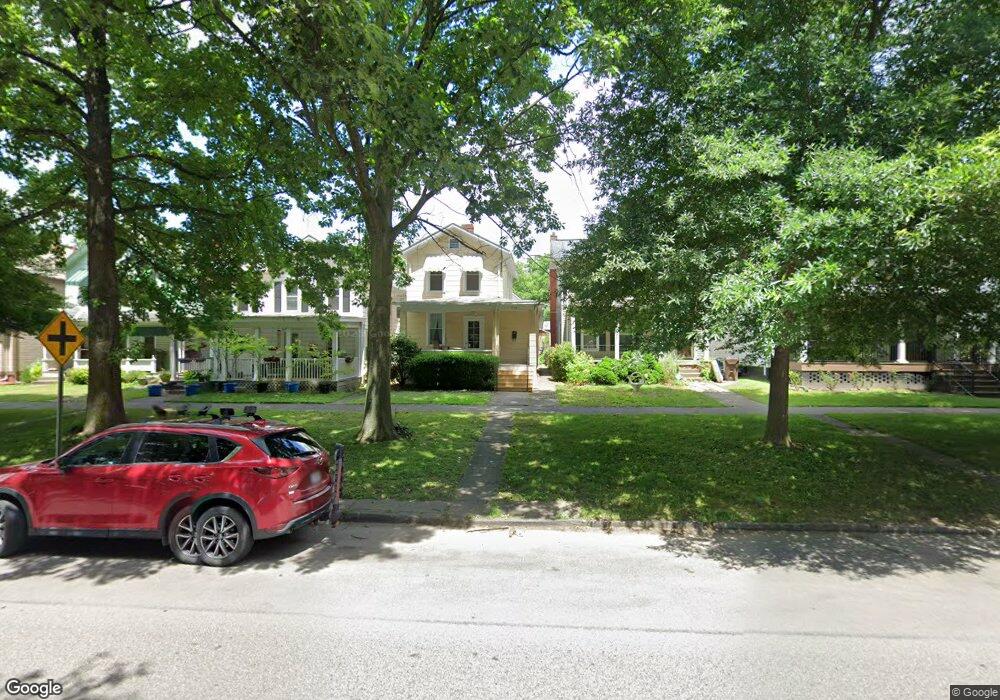
726 3rd St Marietta, OH 45750
Estimated Value: $150,000 - $195,421
2
Beds
2
Baths
1,520
Sq Ft
$114/Sq Ft
Est. Value
About This Home
This home is located at 726 3rd St, Marietta, OH 45750 and is currently estimated at $172,605, approximately $113 per square foot. 726 3rd St is a home located in Washington County with nearby schools including Marietta High School, St. Mary Catholic School, and Veritas Classical Academy.
Ownership History
Date
Name
Owned For
Owner Type
Purchase Details
Closed on
Feb 25, 2026
Sold by
Medley Rick
Bought by
Miller Landon
Current Estimated Value
Home Financials for this Owner
Home Financials are based on the most recent Mortgage that was taken out on this home.
Original Mortgage
$200,000
Outstanding Balance
$200,000
Interest Rate
7%
Mortgage Type
Credit Line Revolving
Estimated Equity
-$27,395
Purchase Details
Closed on
Apr 30, 2009
Sold by
Bronski Noreen B
Bought by
Bronski Brett M and Bronski Amy
Home Financials for this Owner
Home Financials are based on the most recent Mortgage that was taken out on this home.
Original Mortgage
$73,078
Interest Rate
5.05%
Mortgage Type
Future Advance Clause Open End Mortgage
Purchase Details
Closed on
Nov 4, 2004
Bought by
Bronski Noreen B Trustee
Purchase Details
Closed on
Jul 15, 2003
Bought by
Gowan Dana A
Create a Home Valuation Report for This Property
The Home Valuation Report is an in-depth analysis detailing your home's value as well as a comparison with similar homes in the area
Home Values in the Area
Average Home Value in this Area
Purchase History
| Date | Buyer | Sale Price | Title Company |
|---|---|---|---|
| Miller Landon | $200,000 | None Listed On Document | |
| Bronski Brett M | $120,000 | Attorney | |
| Bronski Noreen B Trustee | $122,000 | -- | |
| Bronski Noreen B Trustee | $122,000 | -- | |
| Gowan Dana A | $79,500 | -- | |
| Gowan Dana A | $79,500 | -- |
Source: Public Records
Mortgage History
| Date | Status | Borrower | Loan Amount |
|---|---|---|---|
| Open | Miller Landon | $200,000 | |
| Previous Owner | Bronski Brett M | $73,078 |
Source: Public Records
Tax History
| Year | Tax Paid | Tax Assessment Tax Assessment Total Assessment is a certain percentage of the fair market value that is determined by local assessors to be the total taxable value of land and additions on the property. | Land | Improvement |
|---|---|---|---|---|
| 2024 | $2,283 | $56,940 | $8,750 | $48,190 |
| 2023 | $1,931 | $56,940 | $8,750 | $48,190 |
| 2022 | $2,137 | $63,510 | $8,750 | $54,760 |
| 2021 | $1,737 | $48,940 | $7,180 | $41,760 |
| 2020 | $1,741 | $48,940 | $7,180 | $41,760 |
| 2019 | $1,743 | $48,940 | $7,180 | $41,760 |
| 2018 | $1,619 | $44,160 | $5,970 | $38,190 |
| 2017 | $1,412 | $38,590 | $5,970 | $32,620 |
| 2016 | $1,702 | $26,530 | $5,970 | $20,560 |
| 2015 | $1,018 | $26,530 | $5,970 | $20,560 |
| 2014 | $2,710 | $42,160 | $5,970 | $36,190 |
| 2013 | $805 | $42,160 | $5,970 | $36,190 |
Source: Public Records
Map
Nearby Homes
Your Personal Tour Guide
Ask me questions while you tour the home.