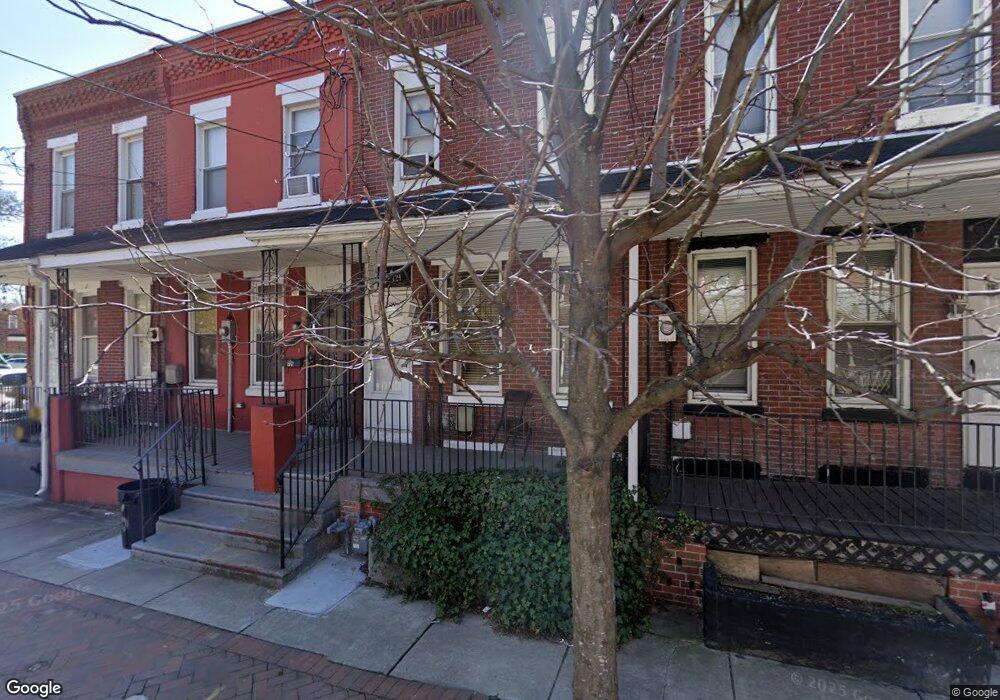
726 Berkley St Camden, NJ 08103
Lanning Square NeighborhoodEstimated Value: $127,000 - $157,000
3
Beds
1
Bath
1,102
Sq Ft
$128/Sq Ft
Est. Value
About This Home
This home is located at 726 Berkley St, Camden, NJ 08103 and is currently estimated at $141,447, approximately $128 per square foot. 726 Berkley St is a home located in Camden County with nearby schools including Camden High School, Leap Academy University Charter School, and Hope Community Charter School.
Ownership History
Date
Name
Owned For
Owner Type
Purchase Details
Closed on
Aug 14, 2009
Sold by
Saint Joseph Carpenter Society
Bought by
Antelo Jose M
Current Estimated Value
Home Financials for this Owner
Home Financials are based on the most recent Mortgage that was taken out on this home.
Original Mortgage
$68,500
Outstanding Balance
$44,571
Interest Rate
5.17%
Mortgage Type
Purchase Money Mortgage
Estimated Equity
$96,876
Purchase Details
Closed on
Jan 12, 2006
Sold by
726 Berkley Llc
Bought by
St Josephs Carpenter Society
Purchase Details
Closed on
Apr 20, 2004
Sold by
Gerhadt Thomas J
Bought by
Stern Marc and Fisher Mayer
Purchase Details
Closed on
Oct 9, 1995
Sold by
Barsky Inc
Bought by
Gerhardt Thomas and Gerhard Lisa
Home Financials for this Owner
Home Financials are based on the most recent Mortgage that was taken out on this home.
Original Mortgage
$13,000
Interest Rate
7.53%
Create a Home Valuation Report for This Property
The Home Valuation Report is an in-depth analysis detailing your home's value as well as a comparison with similar homes in the area
Home Values in the Area
Average Home Value in this Area
Purchase History
| Date | Buyer | Sale Price | Title Company |
|---|---|---|---|
| Antelo Jose M | $70,000 | -- | |
| St Josephs Carpenter Society | $50,000 | -- | |
| Stern Marc | $34,000 | -- | |
| Gerhardt Thomas | $17,000 | -- |
Source: Public Records
Mortgage History
| Date | Status | Borrower | Loan Amount |
|---|---|---|---|
| Open | Antelo Jose M | $68,500 | |
| Previous Owner | Gerhardt Thomas | $13,000 |
Source: Public Records
Tax History Compared to Growth
Tax History
| Year | Tax Paid | Tax Assessment Tax Assessment Total Assessment is a certain percentage of the fair market value that is determined by local assessors to be the total taxable value of land and additions on the property. | Land | Improvement |
|---|---|---|---|---|
| 2025 | $1,998 | $56,400 | $6,000 | $50,400 |
| 2024 | $1,932 | $56,400 | $6,000 | $50,400 |
| 2023 | $1,932 | $56,400 | $6,000 | $50,400 |
| 2022 | $1,896 | $56,400 | $6,000 | $50,400 |
| 2021 | $1,889 | $56,400 | $6,000 | $50,400 |
| 2020 | $1,794 | $56,400 | $6,000 | $50,400 |
| 2019 | $1,717 | $56,400 | $6,000 | $50,400 |
| 2018 | $1,708 | $56,400 | $6,000 | $50,400 |
| 2017 | $1,667 | $56,400 | $6,000 | $50,400 |
| 2016 | $1,614 | $56,400 | $6,000 | $50,400 |
| 2015 | $1,553 | $56,400 | $6,000 | $50,400 |
| 2014 | $1,516 | $56,400 | $6,000 | $50,400 |
Source: Public Records
Map
Nearby Homes
- 700 New St Unit 308
- 637 637 Royden
- 715 S 8th St
- 803 Princeton Ave
- 746 Pine St
- 611 Saint John St
- 810 S 6th St
- 836 S 8th St
- 724 Spruce St
- 718 Spruce St
- 602 S 5th St
- 513 Benson St
- 604 S 5th St
- 917 S 8th St
- 1020 Ramona Gonzalez St
- 418 Benson St
- 764 Mount Vernon St
- 507 S 4th St
- 328 Line St
- 321 Washington St