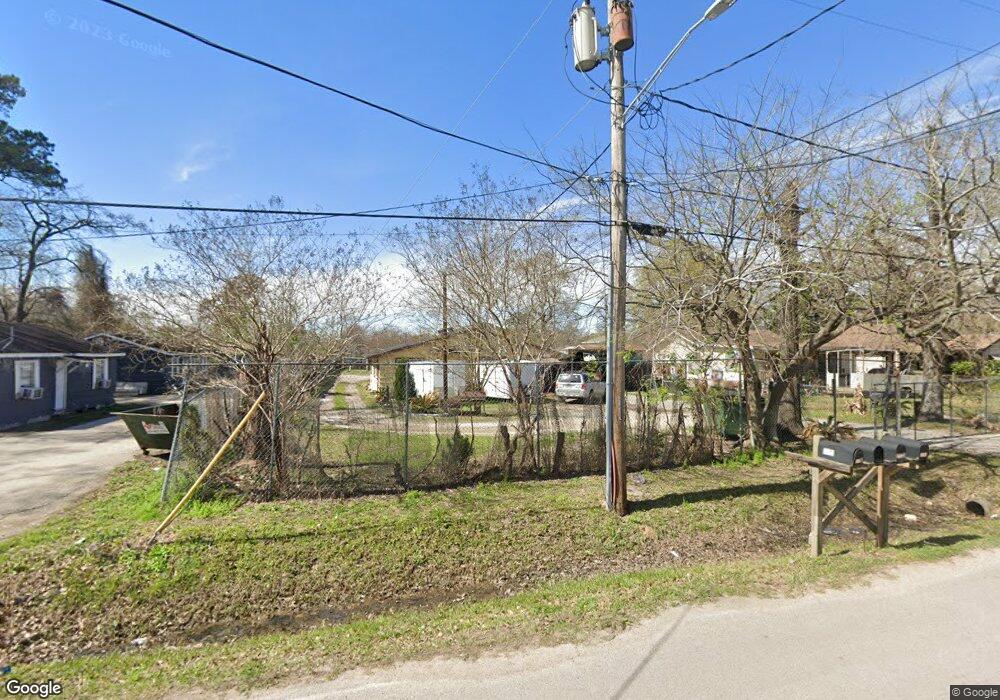
726 Coolidge St Channelview, TX 77530
Estimated Value: $164,000 - $607,000
8
Beds
5
Baths
1,424
Sq Ft
$229/Sq Ft
Est. Value
About This Home
This home is located at 726 Coolidge St, Channelview, TX 77530 and is currently estimated at $326,798, approximately $229 per square foot. 726 Coolidge St is a home located in Harris County with nearby schools including Channelview High School.
Ownership History
Date
Name
Owned For
Owner Type
Purchase Details
Closed on
Jul 13, 2010
Sold by
Silva Saul
Bought by
Diosdado Raquel
Current Estimated Value
Purchase Details
Closed on
Sep 19, 2007
Sold by
Mendoza Ramon and Mendoza Marcela
Bought by
Silva Saul
Home Financials for this Owner
Home Financials are based on the most recent Mortgage that was taken out on this home.
Original Mortgage
$81,000
Interest Rate
6.66%
Mortgage Type
Seller Take Back
Purchase Details
Closed on
Mar 29, 2007
Sold by
Us Bank Na
Bought by
Mendoza Ramon and Mendoza Marcela
Purchase Details
Closed on
Sep 6, 2006
Sold by
Akowei Joel P
Bought by
Us Bank Na and Structured Asset Investment Loan Trust 2
Purchase Details
Closed on
Feb 18, 2005
Sold by
Bendel Investment Llc
Bought by
Akowei Joel P
Home Financials for this Owner
Home Financials are based on the most recent Mortgage that was taken out on this home.
Original Mortgage
$166,500
Interest Rate
5.71%
Mortgage Type
Purchase Money Mortgage
Create a Home Valuation Report for This Property
The Home Valuation Report is an in-depth analysis detailing your home's value as well as a comparison with similar homes in the area
Home Values in the Area
Average Home Value in this Area
Purchase History
| Date | Buyer | Sale Price | Title Company |
|---|---|---|---|
| Diosdado Raquel | -- | Texas American Title Company | |
| Silva Saul | -- | Chicago Title | |
| Mendoza Ramon | -- | None Available | |
| Us Bank Na | $176,856 | None Available | |
| Akowei Joel P | -- | American Title Co |
Source: Public Records
Mortgage History
| Date | Status | Borrower | Loan Amount |
|---|---|---|---|
| Previous Owner | Silva Saul | $81,000 | |
| Previous Owner | Akowei Joel P | $166,500 |
Source: Public Records
Tax History
| Year | Tax Paid | Tax Assessment Tax Assessment Total Assessment is a certain percentage of the fair market value that is determined by local assessors to be the total taxable value of land and additions on the property. | Land | Improvement |
|---|---|---|---|---|
| 2025 | $4,846 | $242,191 | $101,813 | $140,378 |
| 2024 | $4,846 | $244,022 | $101,813 | $142,209 |
| 2023 | $4,846 | $248,279 | $75,341 | $172,938 |
| 2022 | $5,619 | $249,692 | $46,834 | $202,858 |
| 2021 | $5,239 | $225,167 | $46,834 | $178,333 |
| 2020 | $4,637 | $190,871 | $46,834 | $144,037 |
| 2019 | $4,188 | $168,722 | $46,834 | $121,888 |
| 2018 | $2,355 | $168,722 | $46,834 | $121,888 |
| 2017 | $4,207 | $168,722 | $46,834 | $121,888 |
| 2016 | $3,660 | $146,807 | $26,471 | $120,336 |
| 2015 | $3,741 | $146,807 | $26,471 | $120,336 |
| 2014 | $3,741 | $146,807 | $26,471 | $120,336 |
Source: Public Records
Map
Nearby Homes
- 621 Elsbeth St
- 908 Lakeside Dr
- 16935 Market St
- 16526 Market St
- 16534 Market St
- 108 Cedar Ln
- TBD E Freeway Service Rd
- 15627 Market St
- 16809 Market St
- 301 Bayou Dr
- 15627 S Brentwood St
- 16032 1/2 Ridlon St
- 16128 Ridlon St
- 16722 Avenue B
- 726 Banton St
- 0 Bayou Dr
- 16230 Katherine Ln
- 829 Becker St
- 1017 Woodland St
- 822 Woodhue St
- 726 Coolidge St Unit E
- 726 Coolidge St Unit L
- 726 Coolidge St Unit U
- 724 Coolidge St
- 728 Coolidge St
- 728 Coolidge St Unit B
- 728 Coolidge St Unit D
- 728 Coolidge St Unit C
- 722 Coolidge St
- 718 Coolidge St
- 814 Coolidge St
- 803 Hoover St
- 708 Coolidge St
- 725 Coolidge St
- 807 Coolidge St
- 731 Hoover Rd
- 830 Coolidge St
- 711 Hoover St
- 815 Coolidge St
- 700 Coolidge St
Your Personal Tour Guide
Ask me questions while you tour the home.