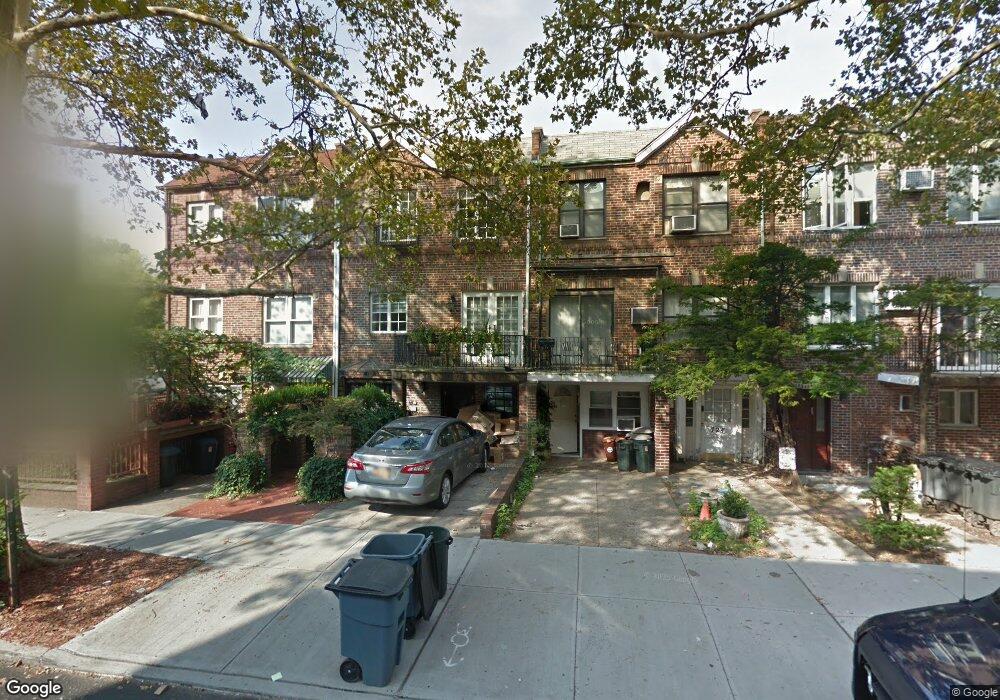
726 E 2nd St Brooklyn, NY 11218
Kensington NeighborhoodEstimated Value: $1,589,000 - $2,091,000
Studio
--
Bath
2,680
Sq Ft
$695/Sq Ft
Est. Value
About This Home
This home is located at 726 E 2nd St, Brooklyn, NY 11218 and is currently estimated at $1,862,241, approximately $694 per square foot. 726 E 2nd St is a home located in Kings County with nearby schools including P.S. 179 Kensington, I.S. 223 The Montauk, and Franklin Delano Roosevelt High School.
Ownership History
Date
Name
Owned For
Owner Type
Purchase Details
Closed on
Jul 29, 2022
Sold by
Schlafrig Moshe Elimelech
Bought by
Schlafrig Moshe Elimelech and Schlafrig Yitzchok Isaac
Current Estimated Value
Purchase Details
Closed on
Jul 3, 2019
Sold by
Mayer Schlafrig Yitzchok Isaac and Schlafrig Blima G
Bought by
Schlafrig Moshe Elimelech
Home Financials for this Owner
Home Financials are based on the most recent Mortgage that was taken out on this home.
Original Mortgage
$726,525
Outstanding Balance
$631,005
Interest Rate
3.82%
Mortgage Type
Purchase Money Mortgage
Estimated Equity
$1,231,236
Purchase Details
Closed on
Jan 3, 1997
Sold by
Stattyn Rita
Bought by
Schlafrig Yitzchok Isaac Mayer and Schlafrig Blima G
Home Financials for this Owner
Home Financials are based on the most recent Mortgage that was taken out on this home.
Original Mortgage
$152,000
Interest Rate
7.36%
Create a Home Valuation Report for This Property
The Home Valuation Report is an in-depth analysis detailing your home's value as well as a comparison with similar homes in the area
Home Values in the Area
Average Home Value in this Area
Purchase History
| Date | Buyer | Sale Price | Title Company |
|---|---|---|---|
| Schlafrig Moshe Elimelech | -- | -- | |
| Schlafrig Moshe Elimelech | $1,095,000 | -- | |
| Schlafrig Yitzchok Isaac Mayer | $160,000 | -- |
Source: Public Records
Mortgage History
| Date | Status | Borrower | Loan Amount |
|---|---|---|---|
| Open | Schlafrig Moshe Elimelech | $726,525 | |
| Previous Owner | Schlafrig Yitzchok Isaac Mayer | $152,000 |
Source: Public Records
Tax History
| Year | Tax Paid | Tax Assessment Tax Assessment Total Assessment is a certain percentage of the fair market value that is determined by local assessors to be the total taxable value of land and additions on the property. | Land | Improvement |
|---|---|---|---|---|
| 2025 | $9,267 | $103,440 | $22,380 | $81,060 |
| 2024 | $9,267 | $81,720 | $22,380 | $59,340 |
| 2023 | $9,370 | $88,560 | $22,380 | $66,180 |
| 2022 | $9,141 | $84,600 | $22,380 | $62,220 |
| 2021 | $9,091 | $92,760 | $22,380 | $70,380 |
| 2019 | $8,043 | $80,880 | $22,380 | $58,500 |
| 2018 | $7,838 | $38,448 | $14,800 | $23,648 |
| 2017 | $7,779 | $38,158 | $17,045 | $21,113 |
| 2016 | $7,197 | $35,999 | $18,444 | $17,555 |
| 2015 | $4,311 | $33,962 | $22,974 | $10,988 |
| 2014 | $4,311 | $32,040 | $24,840 | $7,200 |
Source: Public Records
Map
Nearby Homes
- 821 McDonald Ave
- 819 McDonald Ave
- 943 McDonald Ave
- 734 E 5th St Unit 3R
- 688 E 4th St
- 302 Ditmas Ave
- 304 Ditmas Ave
- 306 Ditmas Ave
- 755 McDonald Ave
- 751 McDonald Ave
- 540 Ocean Pkwy Unit 6D
- 634 E 3rd St
- 702 Ocean Pkwy Unit 1B
- 488 Ocean Pkwy Unit 5E
- 275 Webster Ave Unit 2K
- 275 Webster Ave Unit 4-I
- 275 Webster Ave Unit 1B
- 525 Ocean Pkwy Unit 4J
- 525 Ocean Pkwy Unit 5K
- 264 Webster Ave Unit 408
Your Personal Tour Guide
Ask me questions while you tour the home.