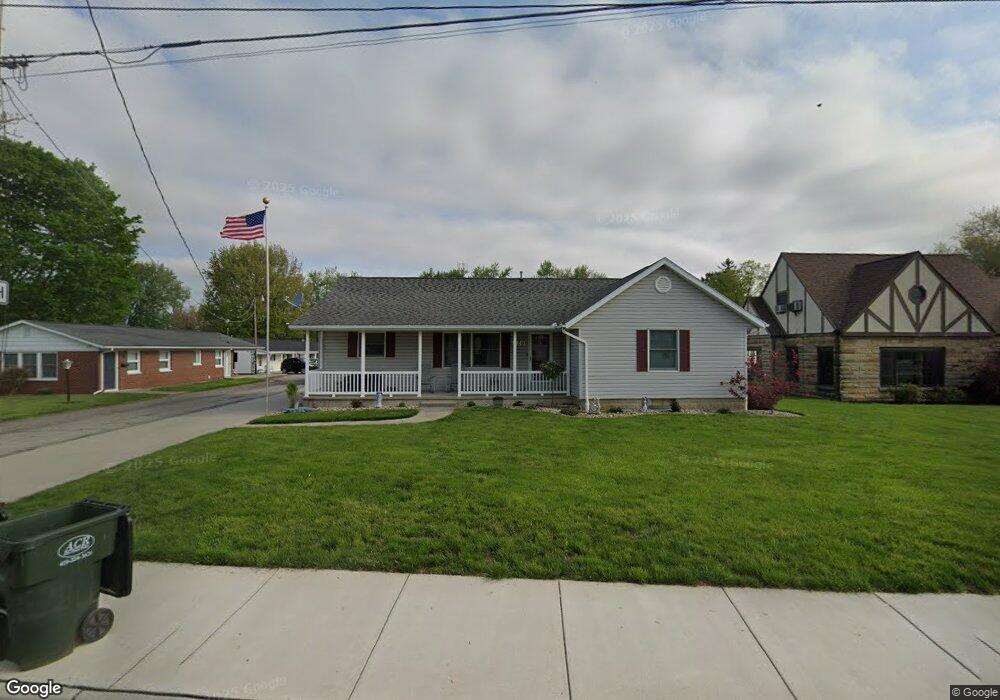
726 E 5th St Delphos, OH 45833
Estimated Value: $165,904 - $210,000
3
Beds
1
Bath
1,366
Sq Ft
$141/Sq Ft
Est. Value
About This Home
This home is located at 726 E 5th St, Delphos, OH 45833 and is currently estimated at $192,226, approximately $140 per square foot. 726 E 5th St is a home located in Allen County with nearby schools including Delphos St. John's High School and Delphos St. John's Elementary School.
Ownership History
Date
Name
Owned For
Owner Type
Purchase Details
Closed on
Jul 20, 2023
Sold by
Wrasman Christopher J and Wrasman Louann Jean
Bought by
Wrasman
Current Estimated Value
Purchase Details
Closed on
Jan 23, 2020
Sold by
Rahrig Lisa Jane and Rahrig Charles P
Bought by
Wrasman Christopher J and Wrasman Louann Jean
Purchase Details
Closed on
Apr 10, 2017
Sold by
Warniment Robert E
Bought by
Rahrig Lisa Jane and Warniment Leslie John
Purchase Details
Closed on
Apr 5, 2007
Sold by
Wagner Ronald John
Bought by
Warniment Robert E and Rahrig Lisa J
Purchase Details
Closed on
Feb 10, 2006
Sold by
Wagner Marilyn J
Bought by
Wagner Ronald John
Purchase Details
Closed on
Dec 14, 1992
Bought by
Pitsenbarger John C
Create a Home Valuation Report for This Property
The Home Valuation Report is an in-depth analysis detailing your home's value as well as a comparison with similar homes in the area
Home Values in the Area
Average Home Value in this Area
Purchase History
| Date | Buyer | Sale Price | Title Company |
|---|---|---|---|
| Wrasman | -- | None Listed On Document | |
| Wrasman Christopher J | -- | None Available | |
| Rahrig Lisa Jane | -- | None Available | |
| Warniment Robert E | $123,000 | None Available | |
| Wagner Ronald John | $46,000 | None Available | |
| Pitsenbarger John C | -- | -- |
Source: Public Records
Tax History
| Year | Tax Paid | Tax Assessment Tax Assessment Total Assessment is a certain percentage of the fair market value that is determined by local assessors to be the total taxable value of land and additions on the property. | Land | Improvement |
|---|---|---|---|---|
| 2024 | $1,522 | $47,990 | $10,190 | $37,800 |
| 2023 | $1,200 | $35,810 | $7,600 | $28,210 |
| 2022 | $1,229 | $35,810 | $7,600 | $28,210 |
| 2021 | $1,236 | $35,810 | $7,600 | $28,210 |
| 2020 | $1,099 | $33,430 | $7,250 | $26,180 |
| 2019 | $1,099 | $33,430 | $7,250 | $26,180 |
| 2018 | $1,113 | $33,430 | $7,250 | $26,180 |
| 2017 | $729 | $31,050 | $7,250 | $23,800 |
| 2016 | $743 | $31,050 | $7,250 | $23,800 |
| 2015 | $732 | $31,050 | $7,250 | $23,800 |
| 2014 | $666 | $28,880 | $6,970 | $21,910 |
| 2013 | $671 | $28,880 | $6,970 | $21,910 |
Source: Public Records
Map
Nearby Homes
- 821 E 3rd St
- 704 N Franklin St
- 405 N Franklin St
- 610 N Washington St
- 201 E 5th St
- 702 N Main St
- 629 N Main St
- 221 S Main St
- 1000 Colettas Way
- 483 S Franklin St
- 310 E Suthoff St
- 424 S Canal St
- 409 N Bredeick St
- 420 S Cass St
- 709 W 4th St
- 7110 Elida Rd
- 537 / 539 Toomey
- 708 W 1st St
- 827 S Washington St
- 10429 Ohio 66
Your Personal Tour Guide
Ask me questions while you tour the home.