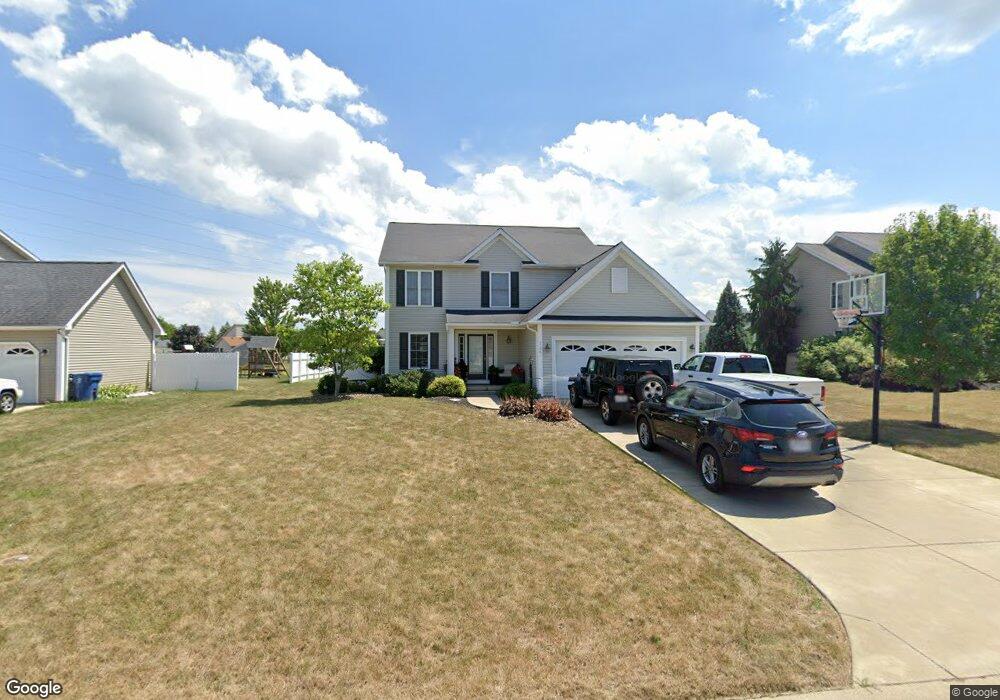
726 Kelley Ln Sandusky, OH 44870
Estimated Value: $319,000 - $350,000
4
Beds
3
Baths
1,980
Sq Ft
$168/Sq Ft
Est. Value
About This Home
This home is located at 726 Kelley Ln, Sandusky, OH 44870 and is currently estimated at $332,654, approximately $168 per square foot. 726 Kelley Ln is a home located in Erie County with nearby schools including Furry Elementary School, Meadowlawn Elementary School, and Briar Middle School.
Ownership History
Date
Name
Owned For
Owner Type
Purchase Details
Closed on
Jul 2, 2012
Sold by
Bechtel Scott A and Snyder Maria P
Bought by
Bush David A and Bush Dena M
Current Estimated Value
Home Financials for this Owner
Home Financials are based on the most recent Mortgage that was taken out on this home.
Original Mortgage
$216,413
Outstanding Balance
$150,514
Interest Rate
3.83%
Mortgage Type
VA
Estimated Equity
$182,140
Purchase Details
Closed on
May 24, 2007
Sold by
Peridia Inc
Bought by
Bechtel Scott A and Snyder Maria P
Home Financials for this Owner
Home Financials are based on the most recent Mortgage that was taken out on this home.
Original Mortgage
$155,000
Interest Rate
6.21%
Mortgage Type
New Conventional
Purchase Details
Closed on
Oct 16, 2006
Sold by
Foresight Development Inc
Bought by
Peridia Inc
Home Financials for this Owner
Home Financials are based on the most recent Mortgage that was taken out on this home.
Original Mortgage
$177,500
Interest Rate
6.5%
Mortgage Type
Future Advance Clause Open End Mortgage
Create a Home Valuation Report for This Property
The Home Valuation Report is an in-depth analysis detailing your home's value as well as a comparison with similar homes in the area
Home Values in the Area
Average Home Value in this Area
Purchase History
| Date | Buyer | Sale Price | Title Company |
|---|---|---|---|
| Bush David A | $209,500 | None Available | |
| Bechtel Scott A | $208,950 | Hartung Title | |
| Peridia Inc | $33,500 | None Available |
Source: Public Records
Mortgage History
| Date | Status | Borrower | Loan Amount |
|---|---|---|---|
| Open | Bush David A | $216,413 | |
| Previous Owner | Bechtel Scott A | $155,000 | |
| Previous Owner | Peridia Inc | $177,500 |
Source: Public Records
Tax History Compared to Growth
Tax History
| Year | Tax Paid | Tax Assessment Tax Assessment Total Assessment is a certain percentage of the fair market value that is determined by local assessors to be the total taxable value of land and additions on the property. | Land | Improvement |
|---|---|---|---|---|
| 2024 | $4,432 | $96,127 | $15,253 | $80,874 |
| 2023 | $4,432 | $79,509 | $12,607 | $66,902 |
| 2022 | $4,504 | $79,509 | $12,607 | $66,902 |
| 2021 | $4,497 | $79,510 | $12,610 | $66,900 |
| 2020 | $3,732 | $66,430 | $12,610 | $53,820 |
| 2019 | $3,842 | $66,430 | $12,610 | $53,820 |
| 2018 | $3,844 | $66,430 | $12,610 | $53,820 |
| 2017 | $3,582 | $60,190 | $12,980 | $47,210 |
| 2016 | $3,129 | $60,190 | $12,980 | $47,210 |
| 2015 | $3,075 | $60,190 | $12,980 | $47,210 |
| 2014 | $3,108 | $60,190 | $12,980 | $47,210 |
| 2013 | $2,899 | $60,190 | $12,980 | $47,210 |
Source: Public Records
Map
Nearby Homes
- 736 Kelley Ln
- 414 Indiana Ave
- 3818 Donair Dr
- 1101 W Bogart Rd
- 1315 S Lake Wilmer Dr Unit 208B
- 1305 S Lake Wilmer Dr Unit 207
- 1305 S Lake Wilmer Dr Unit 208A
- 817 W Bogart Rd
- 1006 W Bogart Rd
- 914 W Bogart Rd
- 301 Schiller Ave
- 4904 Lisbon Cir
- 3314 W Stoneway Dr
- 104 Stonyridge Dr Unit 1-A
- 3513 Spencer Ave
- 0 Us Rte 250 Unit 9066254
- 0 Us Rte 250 Unit 5105465
- 0 Us Rte 250 Unit 20250774
- 516 Woodlawn Ave
- 2920 Campbell St