Estimated Value: $282,000 - $289,000
4
Beds
2
Baths
2,187
Sq Ft
$130/Sq Ft
Est. Value
About This Home
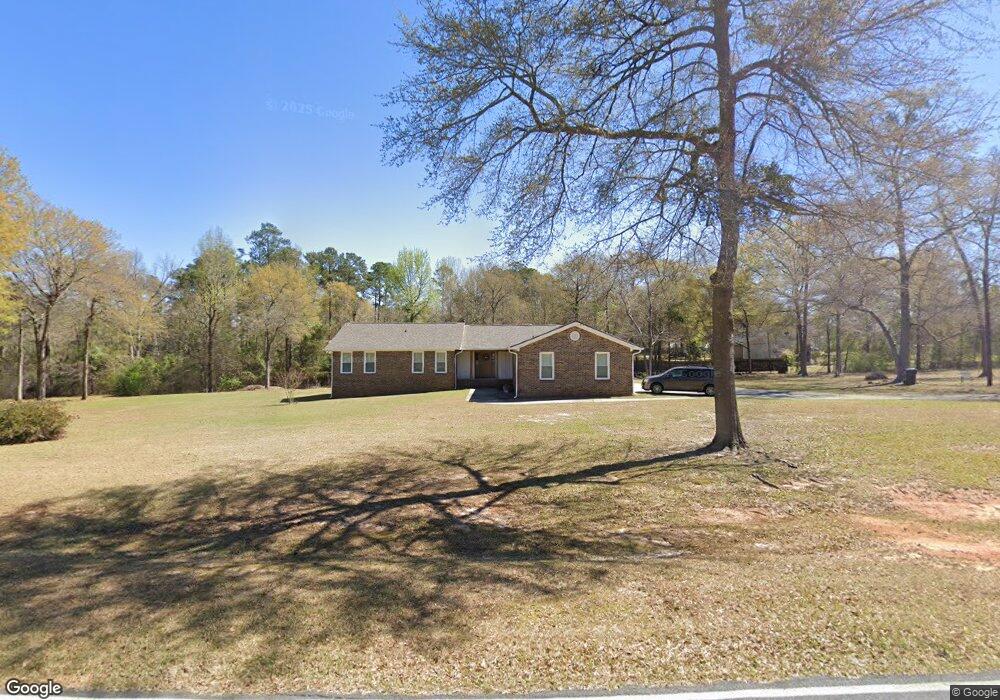
This home is located at 726 Kewanee Dr, Byron, GA 31008 and is currently estimated at $284,648, approximately $130 per square foot. 726 Kewanee Dr is a home located in Peach County with nearby schools including Byron Elementary School, Byron Middle School, and Peach County High School.
Ownership History
Date
Name
Owned For
Owner Type
Purchase Details
Closed on
Oct 19, 2023
Sold by
Clements J Scott
Bought by
Clements J Scott J and Clements Sherri M
Current Estimated Value
Purchase Details
Closed on
Jul 10, 2007
Sold by
Neisler Jeff
Bought by
Clements J Scott and Clements Sherri M
Home Financials for this Owner
Home Financials are based on the most recent Mortgage that was taken out on this home.
Original Mortgage
$90,000
Interest Rate
6.71%
Mortgage Type
New Conventional
Purchase Details
Closed on
Nov 29, 2006
Sold by
Long Thomas N and Long Faye H
Bought by
Lamb Vickie Ann Long
Purchase Details
Closed on
Oct 23, 2006
Sold by
Lamb Vickie Long
Bought by
Neisler Jeff
Purchase Details
Closed on
Mar 31, 1978
Bought by
Long Thomas N and Long Faye H
Create a Home Valuation Report for This Property
The Home Valuation Report is an in-depth analysis detailing your home's value as well as a comparison with similar homes in the area
Home Values in the Area
Average Home Value in this Area
Purchase History
| Date | Buyer | Sale Price | Title Company |
|---|---|---|---|
| Clements J Scott J | -- | -- | |
| Clements J Scott | $162,000 | -- | |
| Lamb Vickie Ann Long | -- | -- | |
| Neisler Jeff | $97,000 | -- | |
| Long Thomas N | -- | -- |
Source: Public Records
Mortgage History
| Date | Status | Borrower | Loan Amount |
|---|---|---|---|
| Previous Owner | Clements J Scott | $90,000 |
Source: Public Records
Tax History Compared to Growth
Tax History
| Year | Tax Paid | Tax Assessment Tax Assessment Total Assessment is a certain percentage of the fair market value that is determined by local assessors to be the total taxable value of land and additions on the property. | Land | Improvement |
|---|---|---|---|---|
| 2024 | $2,256 | $78,880 | $18,800 | $60,080 |
| 2023 | $2,186 | $75,640 | $15,040 | $60,600 |
| 2022 | $1,985 | $68,160 | $15,040 | $53,120 |
| 2021 | $2,015 | $60,000 | $15,040 | $44,960 |
| 2020 | $2,110 | $63,040 | $15,040 | $48,000 |
| 2019 | $2,119 | $63,040 | $15,040 | $48,000 |
| 2018 | $2,129 | $63,040 | $15,040 | $48,000 |
| 2017 | $2,138 | $63,040 | $15,040 | $48,000 |
| 2016 | $2,130 | $63,040 | $15,040 | $48,000 |
| 2015 | $2,133 | $63,040 | $15,040 | $48,000 |
| 2014 | $2,136 | $63,040 | $15,040 | $48,000 |
| 2013 | -- | $63,040 | $15,040 | $48,000 |
Source: Public Records
Map
Nearby Homes
- 231 W Seminole Dr
- 293 Osage Cir
- 234 Cottage Cir
- 124 Timber Ridge Blvd
- 133 Peach Rd
- 467 Kirkland Dr
- 211 Coastal Dr
- 214 Coastal Dr
- 27 Centipede Dr
- 98 Coastal Dr
- 99 Bermuda Dr
- 203 Colonial Dr
- 104 Robinson St
- 7805 Nowell Rd S
- 4001 U S 41 Unit LOT 65
- 00 Dunbar Rd
- 315 Silver Cir
- 2251 Boy Scout Rd
- 204 Sugar Maple Ct
- 109 Silver Maple Ct
- 676 Kewanee Dr
- 755 Kewanee Dr
- 707 Kewanee Dr
- 797 Kewanee Dr
- 743 E Seminole Dr
- 848 Kewanee Dr
- 659 Kewanee Dr
- 839 Kewanee Dr
- 783 E Seminole Dr
- 704 E Seminole Dr
- 881 Kewanee Dr
- 912 Kewanee Dr
- 609 E Seminole Dr
- 408 W Seminole Dr
- 817 E Seminole Dr
- 492 W Seminole Dr
- 605 Kewanee Dr
- 378 W Seminole Dr
- 590 W Seminole Dr
- 480 W Seminole Dr