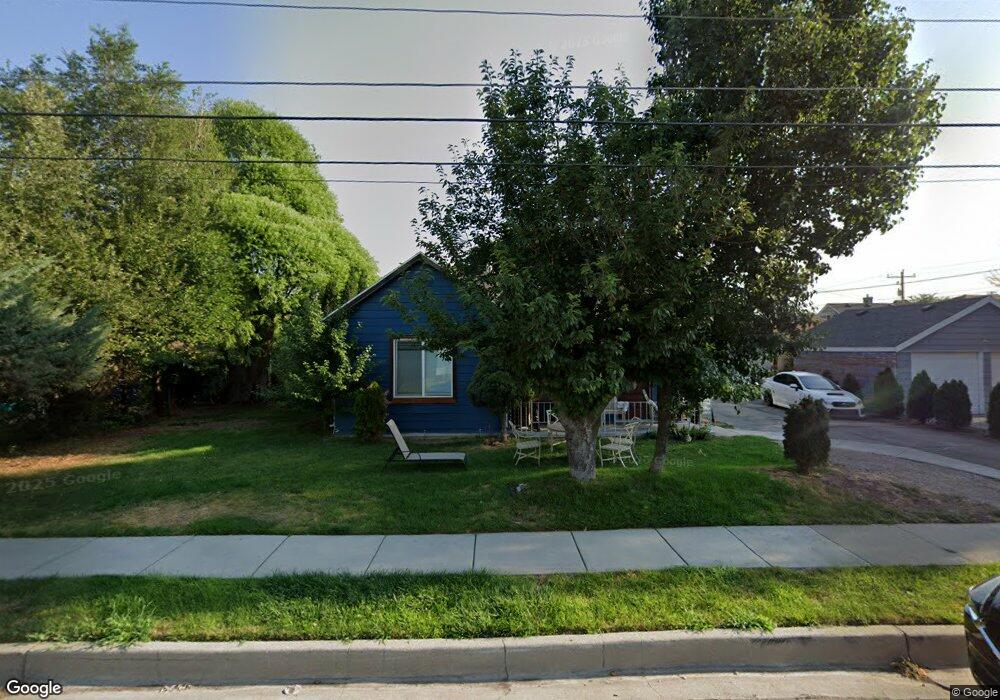
726 Lennox St Midvale, UT 84047
Estimated Value: $471,000
4
Beds
2
Baths
2,613
Sq Ft
$180/Sq Ft
Est. Value
About This Home
This home is located at 726 Lennox St, Midvale, UT 84047 and is currently priced at $471,000, approximately $180 per square foot. 726 Lennox St is a home located in Salt Lake County with nearby schools including Midvale Elementary School, Midvale Middle School, and Hillcrest High School.
Ownership History
Date
Name
Owned For
Owner Type
Purchase Details
Closed on
Aug 6, 2021
Sold by
Quintana Jesus
Bought by
Quintana Jesus and Chavez Maria Estella
Current Estimated Value
Home Financials for this Owner
Home Financials are based on the most recent Mortgage that was taken out on this home.
Original Mortgage
$245,000
Outstanding Balance
$222,881
Interest Rate
2.93%
Mortgage Type
New Conventional
Purchase Details
Closed on
Jul 29, 2021
Sold by
Lifetime Holdings Llc
Bought by
Quintana Jesus
Home Financials for this Owner
Home Financials are based on the most recent Mortgage that was taken out on this home.
Original Mortgage
$245,000
Outstanding Balance
$222,881
Interest Rate
2.93%
Mortgage Type
New Conventional
Purchase Details
Closed on
Feb 11, 2021
Sold by
Myrick Curt D and Myrick Craig W
Bought by
Lifetime Holdings Llc
Purchase Details
Closed on
Jul 13, 2006
Sold by
Armstrong Kim Jenkins and Steinicke Paula Jenkins
Bought by
Armstrong Kim J and Kluss Paula J
Create a Home Valuation Report for This Property
The Home Valuation Report is an in-depth analysis detailing your home's value as well as a comparison with similar homes in the area
Home Values in the Area
Average Home Value in this Area
Purchase History
| Date | Buyer | Sale Price | Title Company |
|---|---|---|---|
| Quintana Jesus | -- | Vanguard Title Union Park | |
| Quintana Jesus | -- | Title Guarantee S Jordan | |
| Lifetime Holdings Llc | -- | Title Guarantee S Jordan | |
| Armstrong Kim J | -- | Eagle Pointe Title |
Source: Public Records
Mortgage History
| Date | Status | Borrower | Loan Amount |
|---|---|---|---|
| Open | Quintana Jesus | $245,000 |
Source: Public Records
Tax History
| Year | Tax Paid | Tax Assessment Tax Assessment Total Assessment is a certain percentage of the fair market value that is determined by local assessors to be the total taxable value of land and additions on the property. | Land | Improvement |
|---|---|---|---|---|
| 2020 | $2,228 | $299,600 | $127,300 | $172,300 |
| 2019 | $2,189 | $287,400 | $127,300 | $160,100 |
| 2018 | $1,873 | $249,400 | $127,300 | $122,100 |
| 2017 | $1,649 | $211,800 | $106,100 | $105,700 |
| 2016 | $1,625 | $202,600 | $106,100 | $96,500 |
| 2015 | $1,718 | $211,200 | $102,900 | $108,300 |
| 2014 | $1,676 | $201,300 | $99,700 | $101,600 |
Source: Public Records
Map
Nearby Homes
- 775 Lennox St
- 7923 S Main St Unit 23
- 7852 Holden St
- 620 W 2nd Ave
- 857 W Shelton Way
- 853 W Cannara Way
- 636 W 4th Ave
- 7689 Locust St
- 652 W Gardenia Dr
- 1047 Soho Dr Unit 1308
- 578 7th Ave
- 576 7th Ave
- 396 Harvard Dr
- 718 W Blue Magic Ln Unit S203
- 718 W Blue Magic Ln Unit S201
- 736 W Blue Magic Ln Unit R303
- 736 W Blue Magic Ln Unit R204
- 736 W Blue Magic Ln Unit R203
- 332 W Harvard Dr
- 8362 S Iris Lumi Ln Unit P303
Your Personal Tour Guide
Ask me questions while you tour the home.