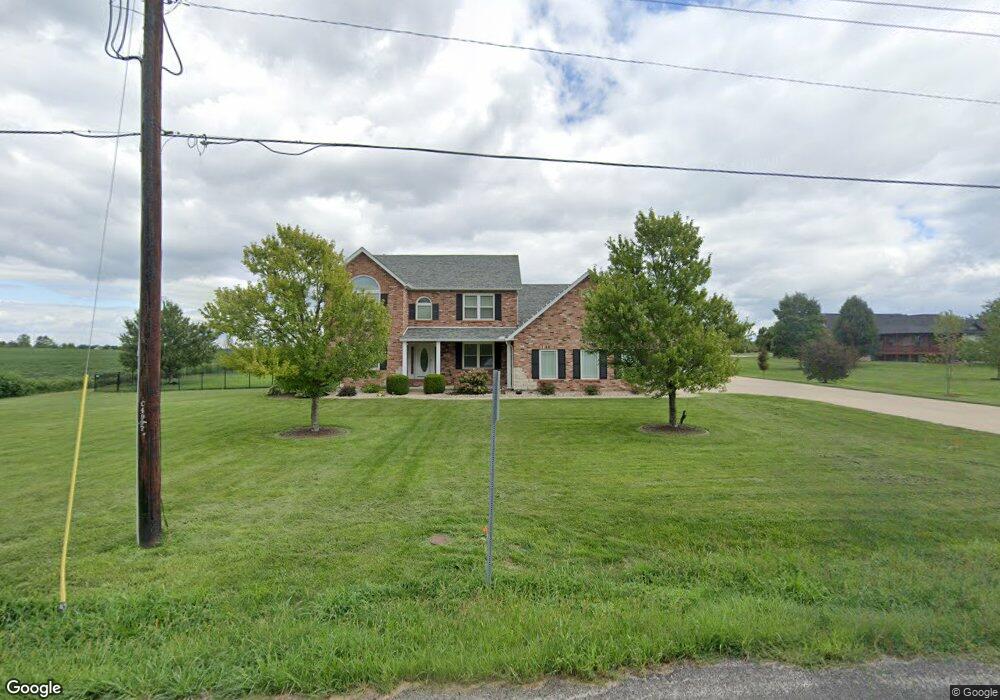
726 Longhi Rd Collinsville, IL 62234
Estimated Value: $551,000 - $596,000
4
Beds
4
Baths
1,801
Sq Ft
$318/Sq Ft
Est. Value
About This Home
This home is located at 726 Longhi Rd, Collinsville, IL 62234 and is currently estimated at $572,479, approximately $317 per square foot. 726 Longhi Rd is a home located in Madison County with nearby schools including Silver Creek Elementary School, Triad Middle School, and Triad High School.
Ownership History
Date
Name
Owned For
Owner Type
Purchase Details
Closed on
Jan 29, 2007
Sold by
Huff Linda
Bought by
Baeske Paul J and Baeske Christine L
Current Estimated Value
Home Financials for this Owner
Home Financials are based on the most recent Mortgage that was taken out on this home.
Original Mortgage
$254,000
Outstanding Balance
$152,389
Interest Rate
6.19%
Mortgage Type
Purchase Money Mortgage
Estimated Equity
$420,090
Purchase Details
Closed on
Jan 25, 2007
Sold by
Rader Brian K
Bought by
Huff Linda
Home Financials for this Owner
Home Financials are based on the most recent Mortgage that was taken out on this home.
Original Mortgage
$254,000
Outstanding Balance
$152,389
Interest Rate
6.19%
Mortgage Type
Purchase Money Mortgage
Estimated Equity
$420,090
Purchase Details
Closed on
Nov 10, 2005
Sold by
Land Solutions Inc
Bought by
Rader Brian K
Home Financials for this Owner
Home Financials are based on the most recent Mortgage that was taken out on this home.
Original Mortgage
$250,000
Interest Rate
6.65%
Mortgage Type
Construction
Create a Home Valuation Report for This Property
The Home Valuation Report is an in-depth analysis detailing your home's value as well as a comparison with similar homes in the area
Home Values in the Area
Average Home Value in this Area
Purchase History
| Date | Buyer | Sale Price | Title Company |
|---|---|---|---|
| Baeske Paul J | $350,000 | Fatic | |
| Huff Linda | -- | Fatic | |
| Rader Brian K | $48,000 | Abstracts & Titles Inc |
Source: Public Records
Mortgage History
| Date | Status | Borrower | Loan Amount |
|---|---|---|---|
| Open | Baeske Paul J | $254,000 | |
| Previous Owner | Rader Brian K | $250,000 |
Source: Public Records
Tax History Compared to Growth
Tax History
| Year | Tax Paid | Tax Assessment Tax Assessment Total Assessment is a certain percentage of the fair market value that is determined by local assessors to be the total taxable value of land and additions on the property. | Land | Improvement |
|---|---|---|---|---|
| 2024 | $11,003 | $176,490 | $28,480 | $148,010 |
| 2023 | $11,003 | $160,230 | $25,860 | $134,370 |
| 2022 | $10,198 | $147,540 | $23,810 | $123,730 |
| 2021 | $9,504 | $140,220 | $22,630 | $117,590 |
| 2020 | $9,510 | $136,600 | $22,050 | $114,550 |
| 2019 | $9,371 | $133,790 | $21,600 | $112,190 |
| 2018 | $9,152 | $123,970 | $20,020 | $103,950 |
| 2017 | $8,858 | $121,380 | $19,600 | $101,780 |
| 2016 | $9,687 | $133,450 | $19,540 | $113,910 |
| 2015 | $8,227 | $129,030 | $18,900 | $110,130 |
| 2014 | $8,227 | $129,030 | $18,900 | $110,130 |
| 2013 | $8,227 | $129,030 | $18,900 | $110,130 |
Source: Public Records
Map
Nearby Homes
- 7302 W Kirsch Rd
- 7001 Lockmann Rd
- 1205 Antler Dr
- 7853 Lebanon Rd
- 2033 Mapleleaf Dr
- 1232 Wentworth Ct
- 8014 Charleston
- 7650 Jeffrey Ct
- 1322 Leland St
- 28 Woodford Way
- 8010 Austin Dr
- 189 Meyer Dr
- 1232 Scuddler
- 1315 Lester Ave
- 6430 Lebanon Rd
- 8037 Austin Dr
- 226 Woodridge Ct
- 112 Crestmoor St
- 131 E Country Ln
- 1002 California Ave
- 7401 Sunset Acres Dr
- XXXX Longhi Rd
- XXX Longhi Rd
- 0 Longhi Rd
- 811 Longhi Rd
- LOT 3 Sunset Acres Dr
- 7409 Sunset Acres Dr
- 823 Longhi Rd
- 714 Longhi Rd
- 1 Rickhaven Dr
- 7417 Sunset Acres Dr
- 7410 Sunset Acres Dr
- 2 Rickhaven Dr
- 708 Longhi Rd
- 841 Longhi Rd
- 3 Rickhaven Dr
- 7235 Clay School Rd
- 7418 Sunset Acres Dr
- 41 Rickhaven Dr
- 702 Longhi Rd