Estimated Value: $78,461
3
Beds
2
Baths
4,000
Sq Ft
$20/Sq Ft
Est. Value
About This Home
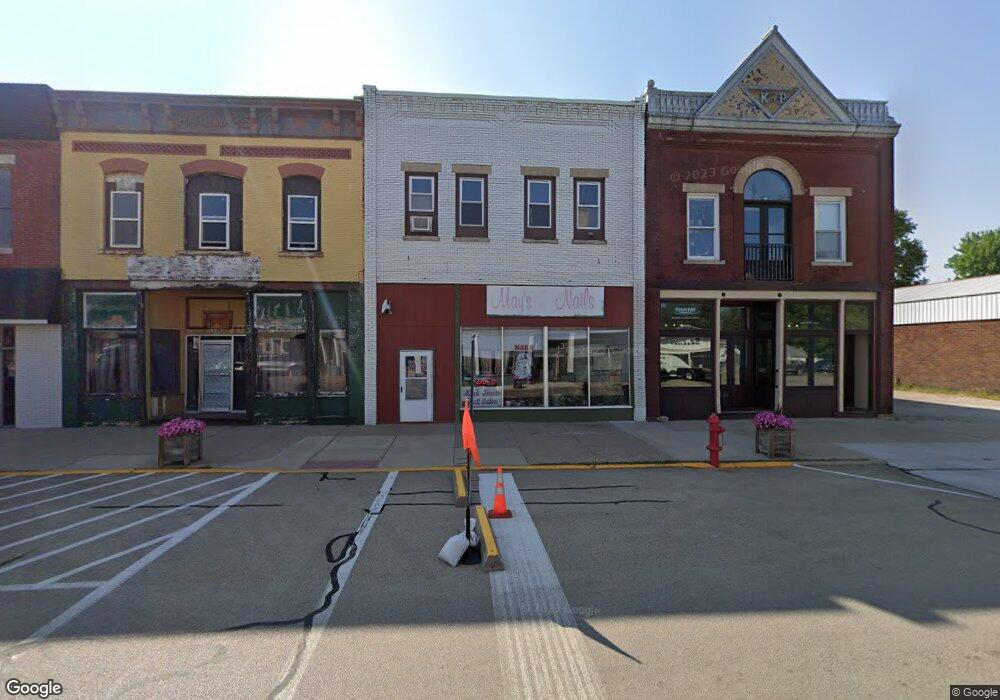
This home is located at 726 Main St, Erie, IL 61250 and is currently estimated at $78,461, approximately $19 per square foot. 726 Main St is a home located in Whiteside County with nearby schools including Erie Elementary School, Erie Middle School, and Erie High School.
Ownership History
Date
Name
Owned For
Owner Type
Purchase Details
Closed on
Sep 2, 2025
Sold by
Huang Mei Gui
Bought by
Wjth Llc
Current Estimated Value
Home Financials for this Owner
Home Financials are based on the most recent Mortgage that was taken out on this home.
Original Mortgage
$120,000
Outstanding Balance
$120,000
Interest Rate
6.74%
Mortgage Type
Credit Line Revolving
Estimated Equity
-$41,539
Purchase Details
Closed on
May 14, 2007
Sold by
Thies Larry D and Thies Monty R
Bought by
Huang Mei Gui
Home Financials for this Owner
Home Financials are based on the most recent Mortgage that was taken out on this home.
Original Mortgage
$40,125
Interest Rate
7.75%
Mortgage Type
Commercial
Create a Home Valuation Report for This Property
The Home Valuation Report is an in-depth analysis detailing your home's value as well as a comparison with similar homes in the area
Home Values in the Area
Average Home Value in this Area
Purchase History
| Date | Buyer | Sale Price | Title Company |
|---|---|---|---|
| Wjth Llc | $130,000 | None Listed On Document | |
| Huang Mei Gui | $53,500 | None Available |
Source: Public Records
Mortgage History
| Date | Status | Borrower | Loan Amount |
|---|---|---|---|
| Open | Wjth Llc | $120,000 | |
| Previous Owner | Huang Mei Gui | $40,125 |
Source: Public Records
Tax History Compared to Growth
Tax History
| Year | Tax Paid | Tax Assessment Tax Assessment Total Assessment is a certain percentage of the fair market value that is determined by local assessors to be the total taxable value of land and additions on the property. | Land | Improvement |
|---|---|---|---|---|
| 2024 | $1,416 | $20,563 | $2,350 | $18,213 |
| 2023 | $1,418 | $20,563 | $2,350 | $18,213 |
| 2022 | $1,432 | $20,563 | $2,350 | $18,213 |
| 2021 | $1,445 | $20,563 | $2,350 | $18,213 |
| 2020 | $1,388 | $19,688 | $1,475 | $18,213 |
| 2019 | $1,328 | $18,821 | $1,475 | $17,346 |
| 2018 | $1,322 | $18,821 | $1,475 | $17,346 |
| 2017 | $1,321 | $18,821 | $1,475 | $17,346 |
| 2016 | $1,320 | $18,821 | $1,475 | $17,346 |
| 2015 | $1,331 | $18,821 | $1,475 | $17,346 |
| 2014 | $1,359 | $18,821 | $1,475 | $17,346 |
| 2013 | $1,331 | $18,821 | $1,475 | $17,346 |
Source: Public Records
Map
Nearby Homes