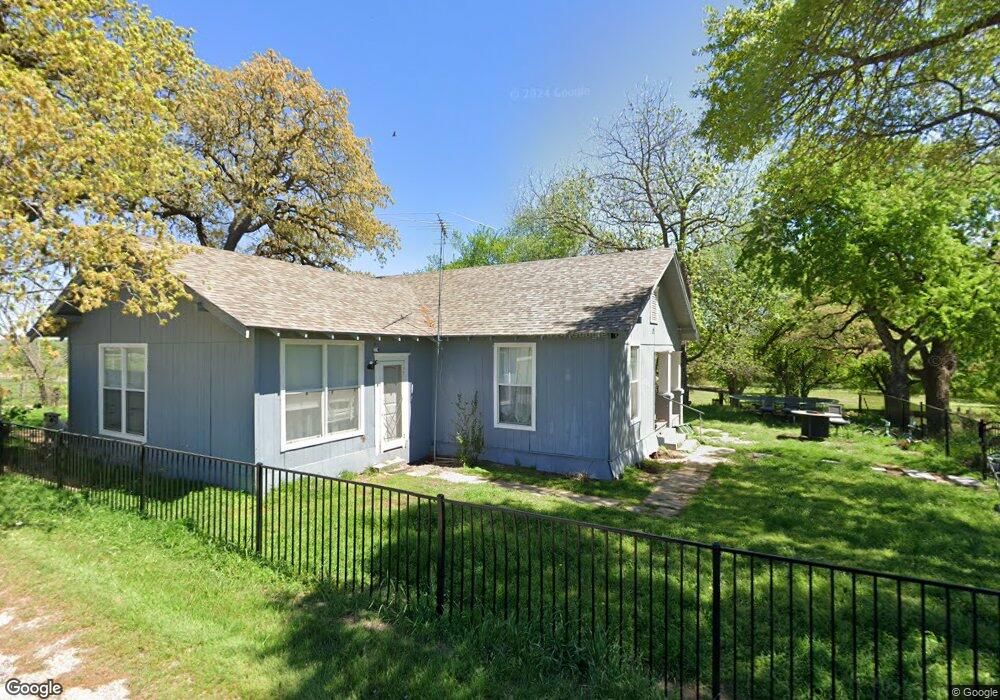
726 N Boundary St Weatherford, TX 76086
Estimated Value: $182,329 - $244,000
--
Bed
--
Bath
1,558
Sq Ft
$145/Sq Ft
Est. Value
About This Home
This home is located at 726 N Boundary St, Weatherford, TX 76086 and is currently estimated at $225,582, approximately $144 per square foot. 726 N Boundary St is a home located in Parker County with nearby schools including Curtis Elementary School, Hall Middle School, and Weatherford High School.
Ownership History
Date
Name
Owned For
Owner Type
Purchase Details
Closed on
Apr 22, 2020
Sold by
Gap Real Estate Ltd
Bought by
Tacuba Ivan and Gaytan Ramos Veronica
Current Estimated Value
Home Financials for this Owner
Home Financials are based on the most recent Mortgage that was taken out on this home.
Original Mortgage
$140,900
Outstanding Balance
$124,583
Interest Rate
3.3%
Mortgage Type
New Conventional
Estimated Equity
$100,999
Purchase Details
Closed on
Nov 24, 2014
Sold by
Cain Rowdy Joel Ray
Bought by
Gap Real Estate Ltd
Purchase Details
Closed on
Aug 22, 2014
Sold by
Cain Williams Theresa Marie
Bought by
Cain Rowdy Joel Ray
Purchase Details
Closed on
Mar 7, 2007
Sold by
Cain Billy and Cain Hortensia
Bought by
Gap Real Estate Ltd
Purchase Details
Closed on
Feb 20, 2007
Sold by
Dobbs Harold and Dobbs Wanda
Bought by
Cain Billy and Cain Hortensia
Purchase Details
Closed on
Nov 2, 2000
Sold by
Dobbs Harold
Bought by
Gap Real Estate Ltd
Create a Home Valuation Report for This Property
The Home Valuation Report is an in-depth analysis detailing your home's value as well as a comparison with similar homes in the area
Home Values in the Area
Average Home Value in this Area
Purchase History
| Date | Buyer | Sale Price | Title Company |
|---|---|---|---|
| Tacuba Ivan | -- | None Available | |
| Gap Real Estate Ltd | -- | Stewart | |
| Cain Rowdy Joel Ray | -- | None Available | |
| Gap Real Estate Ltd | -- | -- | |
| Cain Billy | -- | None Available | |
| Gap Real Estate Ltd | -- | -- |
Source: Public Records
Mortgage History
| Date | Status | Borrower | Loan Amount |
|---|---|---|---|
| Open | Tacuba Ivan | $140,900 |
Source: Public Records
Tax History Compared to Growth
Tax History
| Year | Tax Paid | Tax Assessment Tax Assessment Total Assessment is a certain percentage of the fair market value that is determined by local assessors to be the total taxable value of land and additions on the property. | Land | Improvement |
|---|---|---|---|---|
| 2025 | $812 | $100,188 | -- | -- |
| 2024 | $812 | $91,080 | -- | -- |
| 2023 | $812 | $133,590 | $40,000 | $93,590 |
| 2022 | $1,670 | $75,280 | $15,000 | $60,280 |
| 2021 | $1,808 | $75,280 | $15,000 | $60,280 |
| 2020 | $1,526 | $63,150 | $15,000 | $48,150 |
| 2019 | $1,613 | $63,150 | $15,000 | $48,150 |
| 2018 | $1,417 | $55,260 | $15,000 | $40,260 |
| 2017 | $1,454 | $55,260 | $15,000 | $40,260 |
| 2016 | $1,263 | $48,000 | $15,000 | $33,000 |
| 2015 | $1,237 | $48,000 | $15,000 | $33,000 |
| 2014 | $1,009 | $48,530 | $15,000 | $33,530 |
Source: Public Records
Map
Nearby Homes
- Tract 1 Carter Dr
- 0 North St
- 1102 Chilton St
- 510 N Boundary St
- 506 Chilton St
- 1007 W Water St
- 314 N Dubellette St
- 313 N Dubellette St
- 509 Bryan St
- 707 W Water St
- 430 Vine St
- 302 Case St
- 1318 W Water St
- 427 W Ball St
- 517 W Water St
- 1401 W Ball St
- 217 Clinton Dr
- 1402 W Water St
- 702 W Spring St
- 308 W 1st St
- 1111 Carter Dr
- 723 N Boundary St
- 720 N Boundary St
- Tract 2 Carter
- 718 N Boundary St
- 1104 Carter Dr
- 805 N Boundary St
- TBD Tract 4 Carter
- 0000 Carter Dr
- 715 N Boundary St
- 804 N Boundary St
- 705 Chilton St
- 1012 North St
- 1010 North St
- 1008 North St
- 1000 Chilton St
- 808 North St
- 824 North St
- 816 North St
- 813 North St