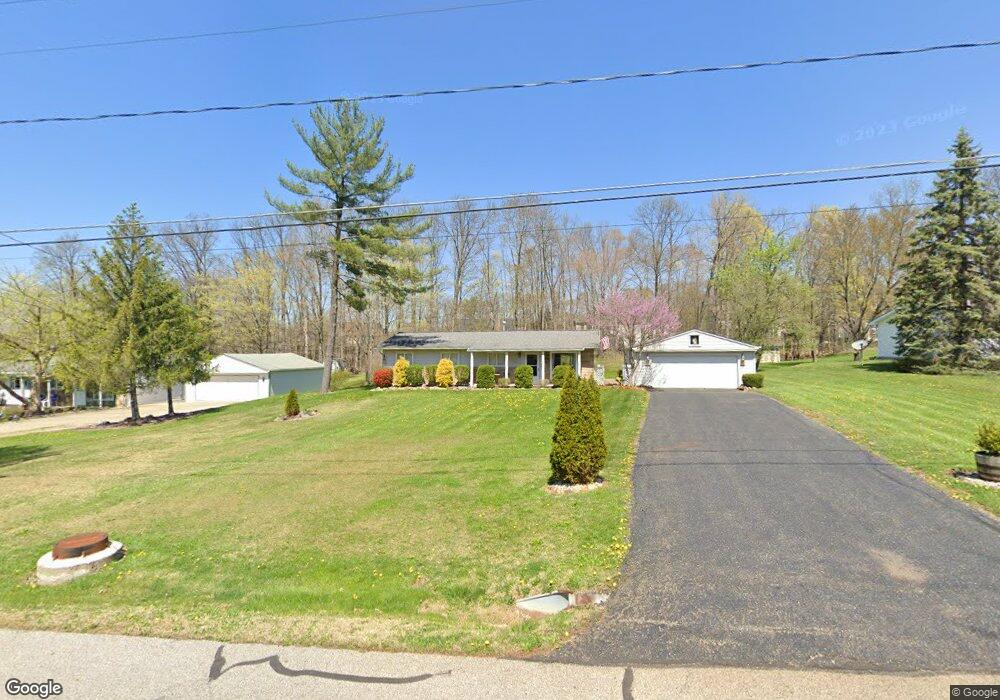
726 Robinhood Dr Aurora, OH 44202
Estimated Value: $243,241 - $277,000
3
Beds
2
Baths
1,170
Sq Ft
$227/Sq Ft
Est. Value
About This Home
This home is located at 726 Robinhood Dr, Aurora, OH 44202 and is currently estimated at $265,810, approximately $227 per square foot. 726 Robinhood Dr is a home located in Portage County with nearby schools including Miller Elementary School, Craddock/Miller Elementary School, and Leighton Elementary School.
Ownership History
Date
Name
Owned For
Owner Type
Purchase Details
Closed on
Sep 24, 2007
Sold by
Morgenstern Shirley J
Bought by
Janice Edda
Current Estimated Value
Home Financials for this Owner
Home Financials are based on the most recent Mortgage that was taken out on this home.
Original Mortgage
$149,897
Outstanding Balance
$95,341
Interest Rate
6.66%
Mortgage Type
Purchase Money Mortgage
Estimated Equity
$170,469
Purchase Details
Closed on
Oct 29, 2003
Sold by
Deskins Pat and Deskins Charles E
Bought by
Morgenstern Daniel C and Morgenstern Shirley J
Home Financials for this Owner
Home Financials are based on the most recent Mortgage that was taken out on this home.
Original Mortgage
$118,750
Interest Rate
6.04%
Mortgage Type
Purchase Money Mortgage
Purchase Details
Closed on
Nov 27, 2002
Sold by
Bartholomew Kathy and Morequity Inc
Bought by
Deskins Pat
Create a Home Valuation Report for This Property
The Home Valuation Report is an in-depth analysis detailing your home's value as well as a comparison with similar homes in the area
Home Values in the Area
Average Home Value in this Area
Purchase History
| Date | Buyer | Sale Price | Title Company |
|---|---|---|---|
| Janice Edda | $146,900 | Attorney | |
| Morgenstern Daniel C | $125,000 | Midland Title Security Inc | |
| Deskins Pat | $82,900 | Midland Title Security Inc |
Source: Public Records
Mortgage History
| Date | Status | Borrower | Loan Amount |
|---|---|---|---|
| Open | Janice Edda | $149,897 | |
| Previous Owner | Morgenstern Daniel C | $118,750 |
Source: Public Records
Tax History Compared to Growth
Tax History
| Year | Tax Paid | Tax Assessment Tax Assessment Total Assessment is a certain percentage of the fair market value that is determined by local assessors to be the total taxable value of land and additions on the property. | Land | Improvement |
|---|---|---|---|---|
| 2024 | $3,319 | $74,140 | $15,160 | $58,980 |
| 2023 | $3,022 | $54,960 | $15,160 | $39,800 |
| 2022 | $2,737 | $54,960 | $15,160 | $39,800 |
| 2021 | $2,752 | $54,960 | $15,160 | $39,800 |
| 2020 | $2,382 | $44,420 | $15,160 | $29,260 |
| 2019 | $2,401 | $44,420 | $15,160 | $29,260 |
| 2018 | $2,305 | $38,750 | $15,160 | $23,590 |
| 2017 | $2,305 | $38,750 | $15,160 | $23,590 |
| 2016 | $2,077 | $38,750 | $15,160 | $23,590 |
| 2015 | $2,136 | $38,750 | $15,160 | $23,590 |
| 2014 | $2,179 | $38,750 | $15,160 | $23,590 |
| 2013 | $2,166 | $38,750 | $15,160 | $23,590 |
Source: Public Records
Map
Nearby Homes
- 794 Robinhood Dr
- 777 Nancy Dr
- 676 Nancy Dr
- 915 Cimarron Oval
- 436 Cochran Rd
- 316 High Bluff
- 185 N Bissell Rd
- S/L 4 Trentstone Cir
- S/L 8 Trentstone Cir
- S/L 15 Trentstone Cir
- S/L 1 Trentstone Cir
- 405 Club Dr W
- 225 Linwood Ln
- 622 Club Dr W
- 640 Club Dr W
- 180 Beaumont Trail
- S/L 3 Iris Place
- 805 Club Dr W
- 752 Club Dr W
- 762 Club Dr W
- 736 Robinhood Dr
- 714 Robinhood Dr
- 744 Robinhood Dr
- 704 Robinhood Dr
- 390 Walnut Ridge Trail
- 380 Walnut Ridge Trail
- 725 Robinhood Dr
- 713 Robinhood Dr
- 735 Robinhood Dr
- 400 Walnut Ridge Trail
- 370 Walnut Ridge Trail
- 754 Robinhood Dr
- 696 Robinhood Dr
- 743 Robinhood Dr
- 703 Robinhood Dr
- 410 Walnut Ridge Trail
- 360 Walnut Ridge Trail
- 753 Robinhood Dr
- 695 Robinhood Dr
- 770 Robinhood Dr