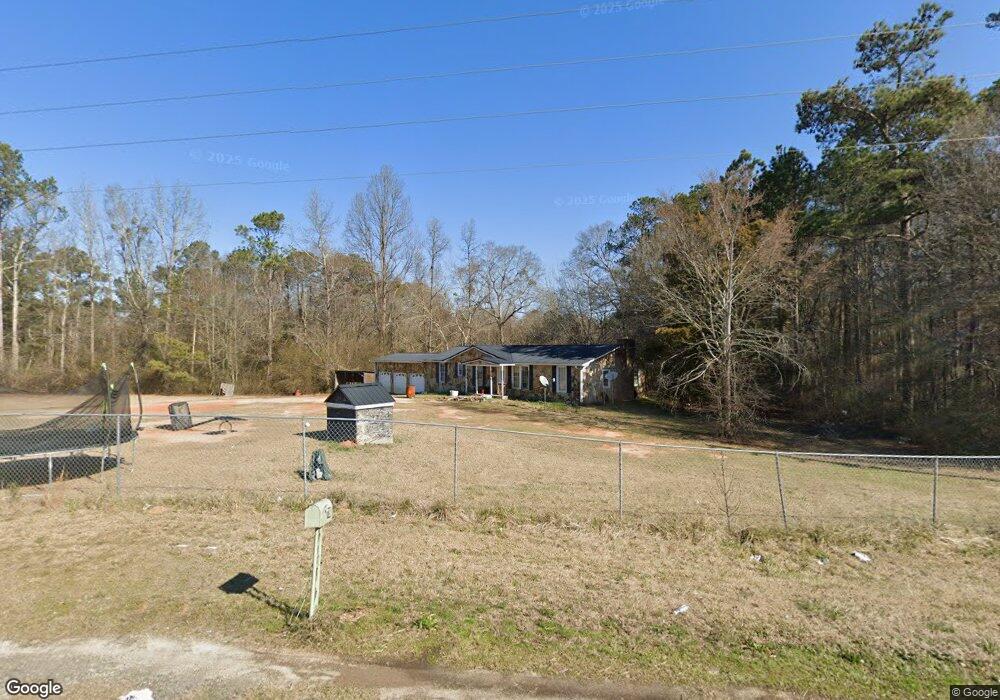
726 Sandy Cross Rd Lexington, GA 30648
Estimated Value: $293,246 - $364,000
3
Beds
2
Baths
2,160
Sq Ft
$153/Sq Ft
Est. Value
About This Home
This home is located at 726 Sandy Cross Rd, Lexington, GA 30648 and is currently estimated at $329,562, approximately $152 per square foot. 726 Sandy Cross Rd is a home located in Oglethorpe County with nearby schools including Oglethorpe County Primary School, Oglethorpe County Elementary School, and Oglethorpe County Middle School.
Create a Home Valuation Report for This Property
The Home Valuation Report is an in-depth analysis detailing your home's value as well as a comparison with similar homes in the area
Home Values in the Area
Average Home Value in this Area
Tax History Compared to Growth
Tax History
| Year | Tax Paid | Tax Assessment Tax Assessment Total Assessment is a certain percentage of the fair market value that is determined by local assessors to be the total taxable value of land and additions on the property. | Land | Improvement |
|---|---|---|---|---|
| 2024 | $2,059 | $86,392 | $1,880 | $84,512 |
| 2023 | $2,213 | $86,392 | $1,880 | $84,512 |
| 2022 | $1,603 | $62,560 | $1,880 | $60,680 |
| 2021 | $1,326 | $54,560 | $1,680 | $52,880 |
| 2020 | $1,349 | $61,840 | $1,680 | $60,160 |
| 2019 | $1,731 | $61,840 | $1,680 | $60,160 |
| 2018 | $904 | $29,941 | $1,289 | $28,652 |
| 2017 | $850 | $29,941 | $1,289 | $28,652 |
| 2016 | $831 | $29,942 | $1,289 | $28,652 |
| 2015 | -- | $29,942 | $1,289 | $28,652 |
| 2014 | -- | $29,942 | $1,289 | $28,652 |
| 2013 | -- | $29,941 | $1,289 | $28,652 |
Source: Public Records
Map
Nearby Homes
- 764 Sandy Cross Rd
- 3 Sandy Cross Rd
- 48 Taylors Grove Ln
- 48 Loyd Smith Rd
- 60 Sandy Cross Rd
- 574 Comer Rd
- 170 Hardwood Rd
- 35 Cherry Cir
- 41 Cherry Cir
- 0 Cherry Cir
- 0 Veribest Rd Unit 24691373
- TBD Oglethorpe Dr
- 219 Piney Grove Rd
- 2018 Elberton Rd
- 173 Comer Rd
- 626 Ruffs Rd
- 1707 Elberton Rd
- 600 Piney Grove Rd
- 104 Watkins Farm Rd
- 702 Sandy Cross Rd
- 748 Sandy Cross Rd
- 24 Bambi Trail
- 81 Watkins Farm Rd
- 798 Sandy Cross Rd
- 68 Watkins Farm Rd
- 71 Watkins Farm Rd
- 712 Sandy Cross Rd
- 1225 Sandy Cross Rd
- 555 Watkins Farm Rd
- LOT 1 Watkins Farm Rd
- 000 Watkins Farm Rd
- 57 Watkins Farm Rd
- 0 Watkins Farm Rd Unit CM373026
- 0 Watkins Farm Rd Unit CM336613
- 0 Watkins Farm Rd Unit 8329237
- 0 Watkins Farm Rd
- 756 Sandy Cross Rd
- 54 Watkins Farm Rd