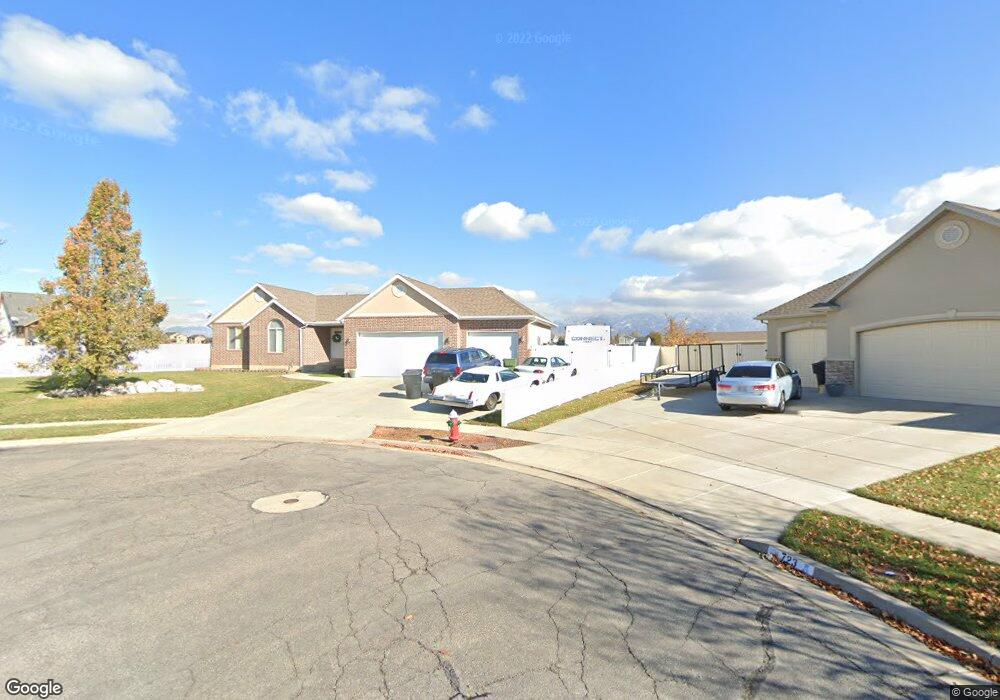
726 W 3400 S Syracuse, UT 84075
Estimated Value: $623,000 - $730,081
3
Beds
3
Baths
3,585
Sq Ft
$186/Sq Ft
Est. Value
About This Home
This home is located at 726 W 3400 S, Syracuse, UT 84075 and is currently estimated at $666,020, approximately $185 per square foot. 726 W 3400 S is a home located in Davis County with nearby schools including Bluff Ridge Elementary, Legacy Junior High School, and Clearfield High School.
Ownership History
Date
Name
Owned For
Owner Type
Purchase Details
Closed on
Dec 16, 2003
Sold by
Penrod Daniel
Bought by
Brinkerhoff Loren C and Brinkerhoff Kristin
Current Estimated Value
Home Financials for this Owner
Home Financials are based on the most recent Mortgage that was taken out on this home.
Original Mortgage
$105,000
Outstanding Balance
$48,577
Interest Rate
5.97%
Mortgage Type
Purchase Money Mortgage
Estimated Equity
$617,443
Purchase Details
Closed on
Feb 4, 2002
Sold by
Chournos Lanse A
Bought by
Penrod Daniel
Home Financials for this Owner
Home Financials are based on the most recent Mortgage that was taken out on this home.
Original Mortgage
$199,650
Interest Rate
7.17%
Purchase Details
Closed on
Sep 24, 2001
Sold by
Silver Lake Estates Llc
Bought by
Chournos Lanse A
Create a Home Valuation Report for This Property
The Home Valuation Report is an in-depth analysis detailing your home's value as well as a comparison with similar homes in the area
Home Values in the Area
Average Home Value in this Area
Purchase History
| Date | Buyer | Sale Price | Title Company |
|---|---|---|---|
| Brinkerhoff Loren C | -- | Heritage West Title Ins | |
| Penrod Daniel | -- | Security Title Company | |
| Chournos Lanse A | -- | Bonneville Title Company Inc |
Source: Public Records
Mortgage History
| Date | Status | Borrower | Loan Amount |
|---|---|---|---|
| Open | Brinkerhoff Loren C | $105,000 | |
| Previous Owner | Penrod Daniel | $199,650 |
Source: Public Records
Tax History Compared to Growth
Tax History
| Year | Tax Paid | Tax Assessment Tax Assessment Total Assessment is a certain percentage of the fair market value that is determined by local assessors to be the total taxable value of land and additions on the property. | Land | Improvement |
|---|---|---|---|---|
| 2025 | $3,757 | $362,450 | $145,100 | $217,350 |
| 2024 | $3,720 | $361,350 | $134,720 | $226,630 |
| 2023 | $3,509 | $621,000 | $186,826 | $434,174 |
| 2022 | $3,679 | $356,950 | $105,436 | $251,514 |
| 2021 | $3,209 | $482,000 | $157,548 | $324,452 |
| 2020 | $2,895 | $421,000 | $129,737 | $291,263 |
| 2019 | $2,786 | $400,000 | $136,052 | $263,948 |
| 2018 | $2,604 | $371,000 | $126,355 | $244,645 |
| 2016 | $2,379 | $177,760 | $48,161 | $129,599 |
| 2015 | $2,410 | $171,490 | $48,161 | $123,329 |
| 2014 | $2,267 | $164,404 | $48,161 | $116,243 |
| 2013 | -- | $146,937 | $46,003 | $100,934 |
Source: Public Records
Map
Nearby Homes
- 967 W Yamada Ct
- 567 W 3575 S
- 3169 S 550 W
- 454 N 3550 W
- 1139 W 3150 S
- 3528 S Finch St
- 803 W 2800 S
- 101 S 3600 W
- 3067 S Old Emigrant Rd Unit B
- 2784 S 1720 W Unit F
- 3637 S Creek Side Ln
- 3583 W 200 S
- 3263 W 850 N
- 3535 W Overlook Dr
- 697 N 3275 W
- 2958 S 1320 W
- 2766 S 1200 W
- 1546 W Parkview Dr
- 245 S Summer Breeze Ln
- 1137 W 2500 S