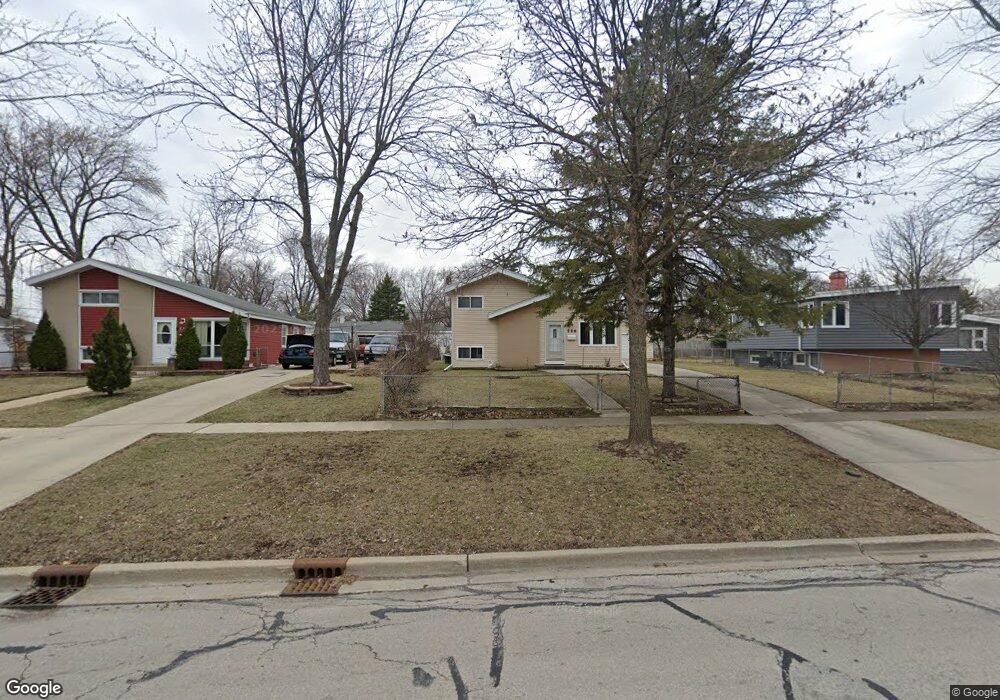
726 W Pleasant St Villa Park, IL 60181
Estimated Value: $295,540 - $371,000
--
Bed
--
Bath
1,026
Sq Ft
$338/Sq Ft
Est. Value
About This Home
This home is located at 726 W Pleasant St, Villa Park, IL 60181 and is currently estimated at $346,385, approximately $337 per square foot. 726 W Pleasant St is a home located in DuPage County with nearby schools including Schafer Elementary School, Jefferson Middle School, and Willowbrook High School.
Ownership History
Date
Name
Owned For
Owner Type
Purchase Details
Closed on
Apr 24, 2009
Sold by
Trajkovic Ljubirka
Bought by
Trajkovic Ljubirka and Trajkovic Ivica
Current Estimated Value
Purchase Details
Closed on
Sep 15, 1999
Sold by
Bartley Lynn A
Bought by
Trajkovic Stanimir and Trajkovic Ljubinka
Home Financials for this Owner
Home Financials are based on the most recent Mortgage that was taken out on this home.
Original Mortgage
$93,500
Outstanding Balance
$27,954
Interest Rate
7.93%
Estimated Equity
$318,431
Purchase Details
Closed on
Jun 1, 1997
Sold by
Swanson Scott T and Swanson Maria Del Carmen
Bought by
Bartley Lynn A
Home Financials for this Owner
Home Financials are based on the most recent Mortgage that was taken out on this home.
Original Mortgage
$134,458
Interest Rate
8%
Mortgage Type
FHA
Create a Home Valuation Report for This Property
The Home Valuation Report is an in-depth analysis detailing your home's value as well as a comparison with similar homes in the area
Home Values in the Area
Average Home Value in this Area
Purchase History
| Date | Buyer | Sale Price | Title Company |
|---|---|---|---|
| Trajkovic Ljubirka | -- | Preferred Title Ins Agency | |
| Trajkovic Stanimir | $146,000 | Premier Title | |
| Bartley Lynn A | $136,500 | -- |
Source: Public Records
Mortgage History
| Date | Status | Borrower | Loan Amount |
|---|---|---|---|
| Open | Trajkovic Stanimir | $93,500 | |
| Previous Owner | Bartley Lynn A | $134,458 |
Source: Public Records
Tax History Compared to Growth
Tax History
| Year | Tax Paid | Tax Assessment Tax Assessment Total Assessment is a certain percentage of the fair market value that is determined by local assessors to be the total taxable value of land and additions on the property. | Land | Improvement |
|---|---|---|---|---|
| 2024 | $6,080 | $88,447 | $12,533 | $75,914 |
| 2023 | $5,778 | $81,790 | $11,590 | $70,200 |
| 2022 | $5,646 | $78,620 | $11,140 | $67,480 |
| 2021 | $5,413 | $76,660 | $10,860 | $65,800 |
| 2020 | $5,282 | $74,980 | $10,620 | $64,360 |
| 2019 | $4,926 | $71,290 | $10,100 | $61,190 |
| 2018 | $4,583 | $63,060 | $8,930 | $54,130 |
| 2017 | $4,466 | $60,090 | $8,510 | $51,580 |
| 2016 | $4,331 | $56,610 | $8,020 | $48,590 |
| 2015 | $3,802 | $52,740 | $7,470 | $45,270 |
| 2014 | $4,799 | $58,890 | $14,350 | $44,540 |
| 2013 | $4,150 | $59,720 | $14,550 | $45,170 |
Source: Public Records
Map
Nearby Homes
- 714 W Pleasant St
- 700 W Pleasant St
- 433 N Lincoln Ave
- 434 N Lincoln Ave
- 434 N Highland Ave
- 131 N Chase Ave
- 417 W Terrace St
- 439 N Fairfield Ave
- 736 E Saint Charles Rd
- 912 E Saint Charles Rd
- 530 N Fairfield Ave
- 600 N Iowa Ave
- 935 E Saint Charles Rd
- 739 N 2nd Ave
- 933 W North Ave Unit A
- 37 N Addison Rd
- 373 N Lombard Ave
- 526 N Harvard Ave
- 2N000 Vista Ave
- 439 N Harvard Ave
- 730 W Pleasant St
- 722 W Pleasant St
- 733 W Vermont St
- 718 W Pleasant St
- 734 W Pleasant St
- 739 W Vermont St
- 729 W Vermont St
- 743 W Vermont St
- 725 W Vermont St
- 738 W Pleasant St
- 719 W Vermont St
- 749 W Vermont St
- 384 N Lincoln Ave
- 379 N Lincoln Ave
- 384 Mission Ave
- 715 W Vermont St
- 710 W Pleasant St
- 380 Mission Ave
- 753 W Vermont St
- 375 N Lincoln Ave