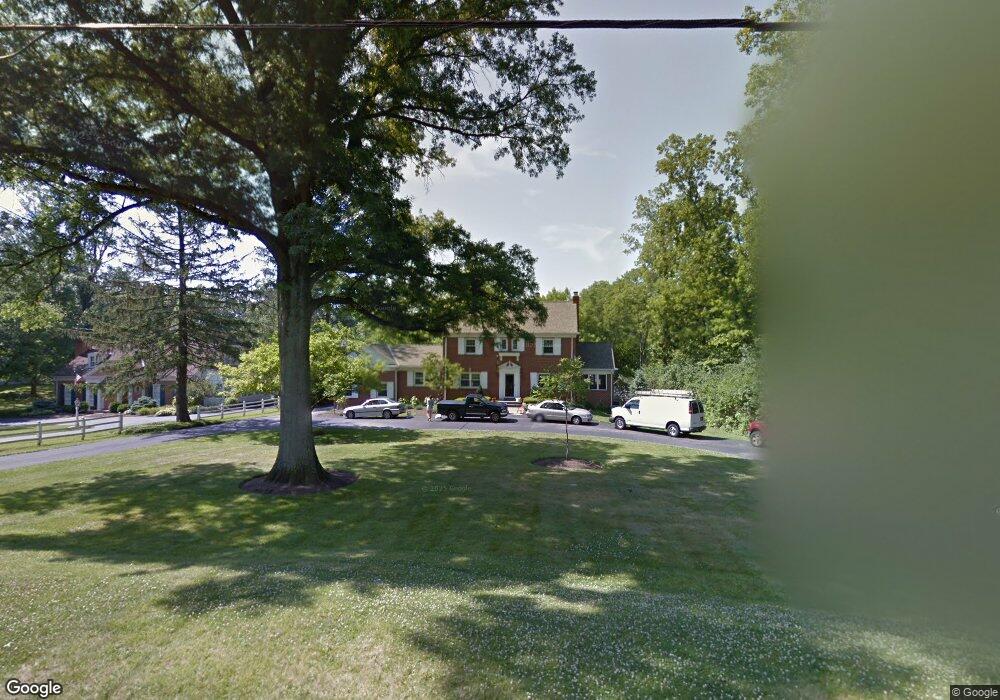
7261 Euclid Ave Cincinnati, OH 45243
Estimated Value: $864,000 - $1,181,000
4
Beds
5
Baths
3,886
Sq Ft
$282/Sq Ft
Est. Value
About This Home
This home is located at 7261 Euclid Ave, Cincinnati, OH 45243 and is currently estimated at $1,096,190, approximately $282 per square foot. 7261 Euclid Ave is a home located in Hamilton County with nearby schools including Madeira Elementary School, Madeira Middle School, and Madeira High School.
Ownership History
Date
Name
Owned For
Owner Type
Purchase Details
Closed on
Oct 31, 2019
Sold by
Reilly J Sean O and Reilly Kathryn A O
Bought by
Powell Adam and Powell Katherine
Current Estimated Value
Home Financials for this Owner
Home Financials are based on the most recent Mortgage that was taken out on this home.
Original Mortgage
$759,050
Outstanding Balance
$655,080
Interest Rate
3.12%
Mortgage Type
New Conventional
Estimated Equity
$441,110
Purchase Details
Closed on
Mar 31, 2006
Sold by
Sanders Doris Cooper and Sanders Charles W
Bought by
Oreilly J Sean and Oreilly Katherine A
Home Financials for this Owner
Home Financials are based on the most recent Mortgage that was taken out on this home.
Original Mortgage
$474,300
Interest Rate
6.34%
Mortgage Type
Unknown
Create a Home Valuation Report for This Property
The Home Valuation Report is an in-depth analysis detailing your home's value as well as a comparison with similar homes in the area
Home Values in the Area
Average Home Value in this Area
Purchase History
| Date | Buyer | Sale Price | Title Company |
|---|---|---|---|
| Powell Adam | $799,000 | None Available | |
| Oreilly J Sean | $555,000 | None Available |
Source: Public Records
Mortgage History
| Date | Status | Borrower | Loan Amount |
|---|---|---|---|
| Open | Powell Adam | $759,050 | |
| Previous Owner | Oreilly J Sean | $474,300 |
Source: Public Records
Tax History
| Year | Tax Paid | Tax Assessment Tax Assessment Total Assessment is a certain percentage of the fair market value that is determined by local assessors to be the total taxable value of land and additions on the property. | Land | Improvement |
|---|---|---|---|---|
| 2025 | $18,872 | $321,073 | $97,874 | $223,199 |
| 2024 | $18,382 | $321,073 | $97,874 | $223,199 |
| 2023 | $18,627 | $321,073 | $97,874 | $223,199 |
| 2022 | $19,846 | $279,650 | $68,509 | $211,141 |
| 2021 | $19,422 | $279,650 | $68,509 | $211,141 |
| 2020 | $17,968 | $279,650 | $68,509 | $211,141 |
| 2019 | $13,643 | $195,892 | $61,170 | $134,722 |
| 2018 | $13,752 | $195,892 | $61,170 | $134,722 |
| 2017 | $13,040 | $195,892 | $61,170 | $134,722 |
| 2016 | $13,381 | $187,348 | $34,818 | $152,530 |
| 2015 | $12,354 | $187,348 | $34,818 | $152,530 |
| 2014 | $12,421 | $187,348 | $34,818 | $152,530 |
| 2013 | $11,826 | $171,882 | $31,945 | $139,937 |
Source: Public Records
Map
Nearby Homes
- 7151 Euclid Ave
- 7159 Hosbrook Rd
- 7220 Mar Del Dr
- 7133 Fowler Ave
- 7317 Euclid Ave
- 7321 Hosbrook Rd
- 7406 Dawson Rd
- 7156 Maple Ave
- 7474 Dawson Rd
- 6752 Rose Crest Ave
- 7503 S Timberlane Dr
- 7834 Laurel Ave
- 7469 Camargo Rd
- 7831 Euclid Ave
- 7845 Euclid Ave
- 7231 Berwood Dr
- 7437 Madeira Pines Dr
- 7300 N Mingo Ln
- 6495 Dawson Rd
- 6604 Madeira Hills Dr
- 7265 Euclid Ave
- 7191 Euclid Ave
- 7133 Mayfield Ave
- 7129 Mayfield Ave
- 7171 Euclid Ave
- 7275 Euclid Ave
- 7189 Juniperview Ln
- 7125 Mayfield Ave
- 7270 Euclid Ave
- 7132 Mayfield Ave
- 7272 Euclid Ave
- 7121 Mayfield Ave
- 7199 Juniperview Ln
- 7128 Mayfield Ave
- 7274 Euclid Ave
- 7177 Juniperview Ln
- 7277 Euclid Ave
- 7117 Mayfield Ave
- 7124 Mayfield Ave
- 7135 Summit Ave
Your Personal Tour Guide
Ask me questions while you tour the home.