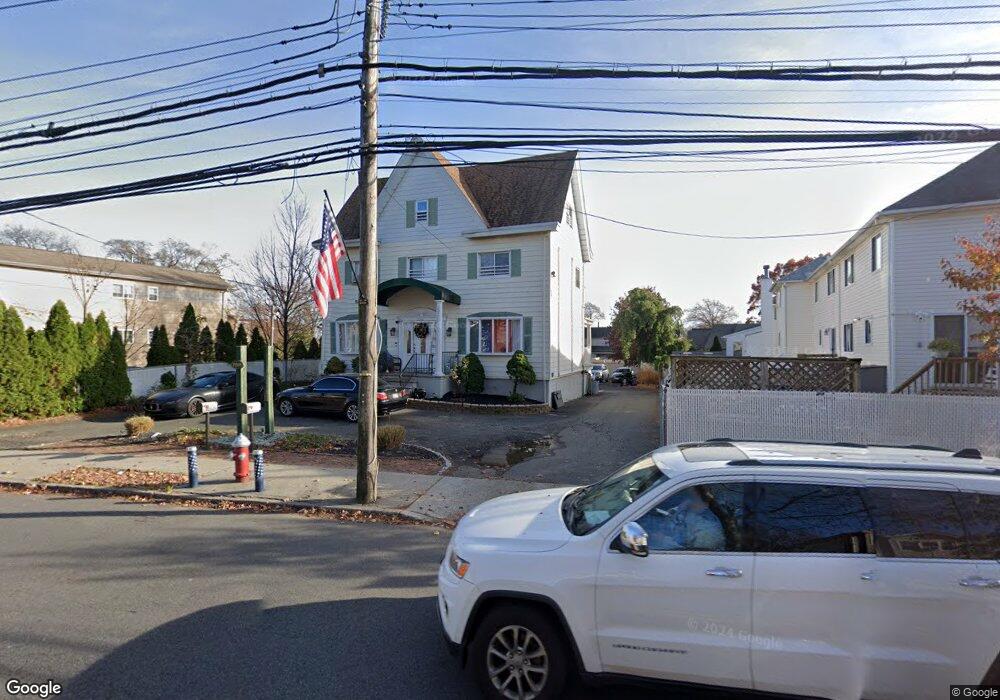
7262C Amboy Rd Staten Island, NY 10307
Tottenville NeighborhoodEstimated Value: $706,000 - $879,000
--
Bed
--
Bath
1,917
Sq Ft
$410/Sq Ft
Est. Value
About This Home
This home is located at 7262C Amboy Rd, Staten Island, NY 10307 and is currently estimated at $786,627, approximately $410 per square foot. 7262C Amboy Rd is a home located in Richmond County with nearby schools including P.S. 6 Cpl Allan F Kivlehan School, Is 34 Tottenville, and Tottenville High School.
Ownership History
Date
Name
Owned For
Owner Type
Purchase Details
Closed on
Feb 27, 2019
Sold by
Lacara Daniela
Bought by
Lacara Daniela A and Lacara Vincenzo
Current Estimated Value
Home Financials for this Owner
Home Financials are based on the most recent Mortgage that was taken out on this home.
Original Mortgage
$121,925
Outstanding Balance
$107,409
Interest Rate
4.5%
Mortgage Type
Adjustable Rate Mortgage/ARM
Estimated Equity
$679,218
Purchase Details
Closed on
Dec 14, 2009
Sold by
Hsbc Bank Usa National Association
Bought by
Lacara Daniela
Home Financials for this Owner
Home Financials are based on the most recent Mortgage that was taken out on this home.
Original Mortgage
$343,660
Interest Rate
5.5%
Mortgage Type
FHA
Purchase Details
Closed on
Jan 8, 2007
Sold by
Alexis Land Holding Corp
Bought by
Patterson Jennifer
Home Financials for this Owner
Home Financials are based on the most recent Mortgage that was taken out on this home.
Original Mortgage
$101,800
Interest Rate
6.21%
Mortgage Type
Purchase Money Mortgage
Create a Home Valuation Report for This Property
The Home Valuation Report is an in-depth analysis detailing your home's value as well as a comparison with similar homes in the area
Home Values in the Area
Average Home Value in this Area
Purchase History
| Date | Buyer | Sale Price | Title Company |
|---|---|---|---|
| Lacara Daniela A | -- | None Available | |
| Lacara Daniela | $350,000 | Rels Title Agency | |
| Patterson Jennifer | $518,085 | None Available |
Source: Public Records
Mortgage History
| Date | Status | Borrower | Loan Amount |
|---|---|---|---|
| Open | Lacara Daniela A | $121,925 | |
| Previous Owner | Lacara Daniela | $343,660 | |
| Previous Owner | Patterson Jennifer | $101,800 |
Source: Public Records
Tax History Compared to Growth
Tax History
| Year | Tax Paid | Tax Assessment Tax Assessment Total Assessment is a certain percentage of the fair market value that is determined by local assessors to be the total taxable value of land and additions on the property. | Land | Improvement |
|---|---|---|---|---|
| 2025 | $6,147 | $44,820 | $4,169 | $40,651 |
| 2024 | $6,147 | $47,880 | $3,682 | $44,198 |
| 2023 | $5,864 | $28,872 | $3,661 | $25,211 |
| 2022 | $5,764 | $36,960 | $5,760 | $31,200 |
| 2021 | $6,030 | $35,940 | $5,760 | $30,180 |
| 2020 | $5,722 | $37,260 | $5,760 | $31,500 |
| 2019 | $5,335 | $33,900 | $5,760 | $28,140 |
| 2018 | $4,905 | $24,060 | $5,760 | $18,300 |
| 2017 | $5,516 | $27,060 | $5,760 | $21,300 |
| 2016 | $5,340 | $26,712 | $4,875 | $21,837 |
| 2015 | $4,858 | $26,712 | $5,510 | $21,202 |
| 2014 | $4,858 | $25,312 | $6,224 | $19,088 |
Source: Public Records
Map
Nearby Homes
- 21 Sprague Ave
- 233 Fisher Ave
- 217-219 Fisher Ave
- 7 Parker St
- 46 Parker St
- 140 Craig Ave
- 197 Craig Ave
- 27 Honey Ln
- 69 Nashville St
- 24 Sapphire Ct
- 0 Minerva Ave Unit 495865
- 90 Giegerich Ave
- 72 Giegerich Ave
- 30 Paradise Place
- 147 Wood Ave
- 133 Fisher Ave
- 101 Bedell Ave
- 200 Cheevers Ln
- 21 Kerry Ln
- 6 Kathleen Ct
- 7246 Amboy Rd
- 7254 Amboy Rd
- 7224 Amboy Rd
- 7247 Amboy Rd Unit House
- 7247 Amboy Rd
- 7251 Amboy Rd
- 7251 Amboy Rd Unit Townhouse
- 7255 Amboy Rd
- 7258 Amboy Rd
- 304 Brehaut Ave
- 7239 Amboy Rd
- 7260 Amboy Rd
- 7220 Amboy Rd
- 7235 Amboy Rd
- 7233 Amboy Rd
- 7233 Amboy Rd Unit 7235
- 275 Barnard Ave
- 316 Brehaut Ave
- 284 Barnard Ave
- 282 Barnard Ave