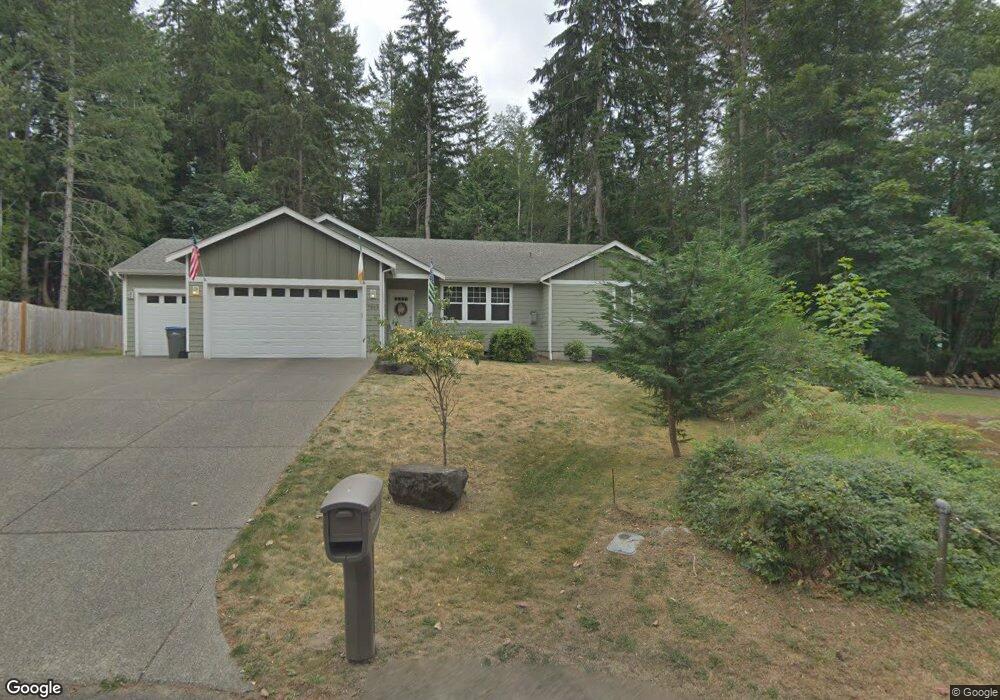
7263 Stevens Ct SE Port Orchard, WA 98367
Estimated Value: $665,921 - $747,000
3
Beds
2
Baths
2,006
Sq Ft
$350/Sq Ft
Est. Value
About This Home
This home is located at 7263 Stevens Ct SE, Port Orchard, WA 98367 and is currently estimated at $702,980, approximately $350 per square foot. 7263 Stevens Ct SE is a home located in Kitsap County with nearby schools including Olalla Elementary School, John Sedgwick Middle School, and South Kitsap High School.
Ownership History
Date
Name
Owned For
Owner Type
Purchase Details
Closed on
Apr 19, 2021
Sold by
Jacob Simon B and Jacob Larysa M
Bought by
Menchen Dawn P and Menchen Wes M
Current Estimated Value
Home Financials for this Owner
Home Financials are based on the most recent Mortgage that was taken out on this home.
Original Mortgage
$369,000
Outstanding Balance
$333,162
Interest Rate
3%
Mortgage Type
New Conventional
Estimated Equity
$369,818
Purchase Details
Closed on
Mar 21, 2014
Sold by
Michael E Allen Construction Inc
Bought by
Jacob Simon B and Jacob Larysa M
Home Financials for this Owner
Home Financials are based on the most recent Mortgage that was taken out on this home.
Original Mortgage
$301,020
Interest Rate
4.25%
Mortgage Type
New Conventional
Purchase Details
Closed on
Mar 20, 2013
Sold by
Anderson Edgar and Anderson Marilyn
Bought by
Michael E Allen Construction Inc
Create a Home Valuation Report for This Property
The Home Valuation Report is an in-depth analysis detailing your home's value as well as a comparison with similar homes in the area
Home Values in the Area
Average Home Value in this Area
Purchase History
| Date | Buyer | Sale Price | Title Company |
|---|---|---|---|
| Menchen Dawn P | $599,000 | Fidelity National Title | |
| Jacob Simon B | $295,280 | Pacific Northwest Title Silv | |
| Michael E Allen Construction Inc | $54,280 | Pacific Nw Title |
Source: Public Records
Mortgage History
| Date | Status | Borrower | Loan Amount |
|---|---|---|---|
| Open | Menchen Dawn P | $369,000 | |
| Previous Owner | Jacob Simon B | $301,020 |
Source: Public Records
Tax History Compared to Growth
Tax History
| Year | Tax Paid | Tax Assessment Tax Assessment Total Assessment is a certain percentage of the fair market value that is determined by local assessors to be the total taxable value of land and additions on the property. | Land | Improvement |
|---|---|---|---|---|
| 2026 | $4,986 | $584,710 | $88,060 | $496,650 |
| 2025 | $4,986 | $584,710 | $88,060 | $496,650 |
| 2024 | $4,833 | $584,710 | $88,060 | $496,650 |
| 2023 | $4,798 | $584,710 | $88,060 | $496,650 |
| 2022 | $4,591 | $468,210 | $70,450 | $397,760 |
| 2021 | $4,251 | $410,110 | $62,900 | $347,210 |
| 2020 | $4,315 | $405,180 | $58,250 | $346,930 |
| 2019 | $3,647 | $375,560 | $54,060 | $321,500 |
| 2018 | $3,848 | $305,040 | $48,930 | $256,110 |
| 2017 | $3,243 | $305,040 | $48,930 | $256,110 |
| 2016 | $3,140 | $270,020 | $46,600 | $223,420 |
| 2015 | $3,034 | $264,570 | $46,600 | $217,970 |
| 2014 | -- | $179,770 | $47,740 | $132,030 |
| 2013 | -- | $47,740 | $47,740 | $0 |
Source: Public Records
Map
Nearby Homes
- 6814 Darla Ln SE
- 0 Long Lake Rd SE Unit NWM2439154
- 0 Long Lake Rd SE Unit NWM2354075
- 7443 Clover Valley Rd SE
- 8610 Long Lake Rd SE
- 4141 SW Muller Ln
- 8423 Dormar Dr SE
- 6223 Ebbert Dr SE
- 4646 SE Green Shores Dr
- 8817 Clearwater Ln SE
- 8964 Lawrence Dr SE
- 3371 SE Bielmeier Rd Unit 85
- 3371 SE Bielmeier Rd Unit 47
- 3371 SE Bielmeier Rd Unit 26
- 3371 SE Bielmeier Rd Unit 91
- 3371 SE Bielmeier Rd Unit 79
- 3371 SE Bielmeier Rd Unit 80
- 3371 SE Bielmeier Rd Unit 95
- 3371 SE Bielmeier Rd Unit 33A
- 6685 Skipper Ln SE
- 7251 Stevens Ct SE
- 5320 SE North St
- 7410 Glacier Ridge Place SE
- 5330 Wayne Place SE
- 7263 Long Lake Rd SE
- 7420 Glacier Ridge Place SE
- 5360 Wayne Place SE
- 5350 SE North St
- 7409 Glacier Ridge Place SE
- 5226 SE North St
- 0 North St Unit 626378
- 2 SE North St
- 5370 Wayne Place SE
- 7430 Glacier Ridge Place SE
- 5335 SE North St