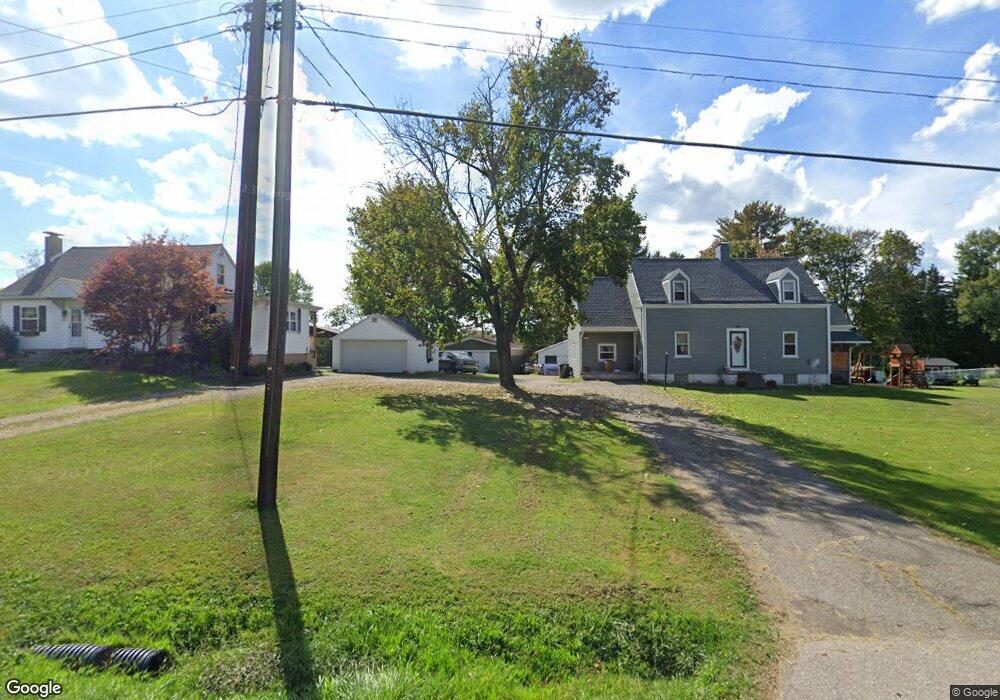
72632 Colerain Rd Dillonvale, OH 43917
Estimated Value: $135,528 - $194,000
3
Beds
1
Bath
964
Sq Ft
$179/Sq Ft
Est. Value
About This Home
This home is located at 72632 Colerain Rd, Dillonvale, OH 43917 and is currently estimated at $172,132, approximately $178 per square foot. 72632 Colerain Rd is a home located in Belmont County with nearby schools including Anna Marie Ayers Elementary School, Martins Ferry Middle School, and Martins Ferry High School.
Ownership History
Date
Name
Owned For
Owner Type
Purchase Details
Closed on
Dec 18, 2015
Sold by
Schrickel Christine L and Schrickel Gary L
Bought by
Jarrett Barbara L
Current Estimated Value
Home Financials for this Owner
Home Financials are based on the most recent Mortgage that was taken out on this home.
Original Mortgage
$52,000
Outstanding Balance
$21,714
Interest Rate
3.88%
Mortgage Type
New Conventional
Estimated Equity
$150,418
Purchase Details
Closed on
May 14, 2014
Sold by
Estate Of Evelyn C Schussler
Bought by
Schrickel Christine L and Schussler Frederick D
Purchase Details
Closed on
Jan 29, 2002
Sold by
Schussler Evelyn C
Bought by
Schussler Evelyn C
Purchase Details
Closed on
Jan 1, 1986
Sold by
Schussler Dale M and Schussler Evelyn
Bought by
Schussler Dale M and Schussler Evelyn
Create a Home Valuation Report for This Property
The Home Valuation Report is an in-depth analysis detailing your home's value as well as a comparison with similar homes in the area
Home Values in the Area
Average Home Value in this Area
Purchase History
| Date | Buyer | Sale Price | Title Company |
|---|---|---|---|
| Jarrett Barbara L | $92,000 | Attorney | |
| Schrickel Christine L | -- | None Available | |
| Schussler Evelyn C | -- | -- | |
| Schussler Dale M | -- | -- |
Source: Public Records
Mortgage History
| Date | Status | Borrower | Loan Amount |
|---|---|---|---|
| Open | Jarrett Barbara L | $52,000 |
Source: Public Records
Tax History Compared to Growth
Tax History
| Year | Tax Paid | Tax Assessment Tax Assessment Total Assessment is a certain percentage of the fair market value that is determined by local assessors to be the total taxable value of land and additions on the property. | Land | Improvement |
|---|---|---|---|---|
| 2024 | $950 | $36,360 | $6,870 | $29,490 |
| 2023 | $835 | $31,010 | $6,870 | $24,140 |
| 2022 | $1,209 | $31,007 | $6,867 | $24,140 |
| 2021 | $1,204 | $31,007 | $6,867 | $24,140 |
| 2020 | $1,112 | $26,960 | $5,970 | $20,990 |
| 2019 | $1,115 | $26,960 | $5,970 | $20,990 |
| 2018 | $1,102 | $26,960 | $5,970 | $20,990 |
| 2017 | $1,069 | $24,640 | $4,940 | $19,700 |
| 2016 | $1,073 | $24,640 | $4,940 | $19,700 |
| 2015 | $1,113 | $24,640 | $4,940 | $19,700 |
| 2014 | $1,027 | $25,010 | $4,490 | $20,520 |
| 2013 | $643 | $25,010 | $4,490 | $20,520 |
Source: Public Records
Map
Nearby Homes
- 0 Terra Ridge Ln
- 71900 Cope St
- 71850 Colerain Rd
- 53979 Colerain Pike
- 73881 Colerain Mount Pleasant Rd
- 61 Township Road 108a
- 53760 Farmington Rd
- 70798 Lollini Rd
- 70610 Chermont Rd
- 70571 Pine Hollow Rd
- 55379 Barnes Rd
- 1749 Us 250
- 543 Union St
- 9 Township Rd
- 70392 Barton Rd
- 0 North St Unit 5148451
- 148 Oak Dr
- 70540 Colerain Rd
- 303 County Road 71
- 50170 Fairpoint Maynard Rd
- 72640 Colerain Rd
- 72622 Colerain Rd
- 72646 Colerain Rd
- 72610 Colerain Rd
- 72664 Colerain Rd
- 250 State Road 250
- 72580 Colerain Rd
- 72669 Colerain Rd
- 72690 Colerain
- 72685 Colerain Rd
- 72763 Colerain Rd Unit FE
- 72581 Colerain Rd
- 72718 U S 250
- 72566 Colerain Rd
- 72725 Colerain Rd
- 72548 Colerain Rd
- 72553 Colerain Rd
- 52820 Sunny Lane Dr
- 72811 Bolon Dr
- 53180 Firemen Ln