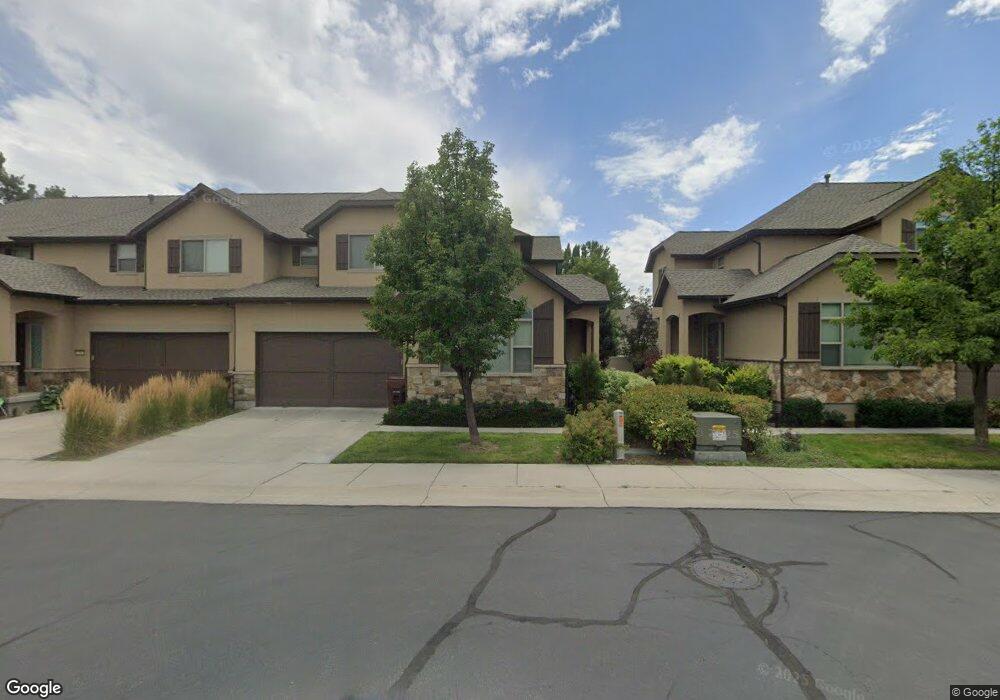
7265 S Viansa Ct Unit 23 Midvale, UT 84047
Estimated Value: $590,000 - $706,000
5
Beds
4
Baths
3,095
Sq Ft
$205/Sq Ft
Est. Value
About This Home
This home is located at 7265 S Viansa Ct Unit 23, Midvale, UT 84047 and is currently estimated at $633,597, approximately $204 per square foot. 7265 S Viansa Ct Unit 23 is a home located in Salt Lake County with nearby schools including Midvalley Elementary School, Hillcrest High School, and Midvale Middle School.
Ownership History
Date
Name
Owned For
Owner Type
Purchase Details
Closed on
Mar 21, 2022
Sold by
Doreen Braun
Bought by
Ddj Trust
Current Estimated Value
Purchase Details
Closed on
Mar 16, 2022
Sold by
Doreen Braun
Bought by
Ddj Trust
Purchase Details
Closed on
Aug 12, 2020
Sold by
Atwood Natalie
Bought by
Braun Doreen
Home Financials for this Owner
Home Financials are based on the most recent Mortgage that was taken out on this home.
Original Mortgage
$346,000
Interest Rate
3%
Mortgage Type
New Conventional
Purchase Details
Closed on
Jun 24, 2015
Sold by
Viansa Villas Development Llc
Bought by
Atwood Natalie
Home Financials for this Owner
Home Financials are based on the most recent Mortgage that was taken out on this home.
Original Mortgage
$251,920
Interest Rate
3.81%
Mortgage Type
New Conventional
Create a Home Valuation Report for This Property
The Home Valuation Report is an in-depth analysis detailing your home's value as well as a comparison with similar homes in the area
Home Values in the Area
Average Home Value in this Area
Purchase History
| Date | Buyer | Sale Price | Title Company |
|---|---|---|---|
| Ddj Trust | -- | None Listed On Document | |
| Ddj Trust | -- | None Listed On Document | |
| Braun Doreen | -- | Inwest Title Srvs Ogden | |
| Atwood Natalie | -- | Metro National Title |
Source: Public Records
Mortgage History
| Date | Status | Borrower | Loan Amount |
|---|---|---|---|
| Previous Owner | Braun Doreen | $346,000 | |
| Previous Owner | Atwood Natalie | $251,920 |
Source: Public Records
Tax History Compared to Growth
Tax History
| Year | Tax Paid | Tax Assessment Tax Assessment Total Assessment is a certain percentage of the fair market value that is determined by local assessors to be the total taxable value of land and additions on the property. | Land | Improvement |
|---|---|---|---|---|
| 2025 | $3,647 | $628,200 | $65,600 | $562,600 |
| 2024 | $3,647 | $598,800 | $61,600 | $537,200 |
| 2023 | $3,594 | $584,700 | $58,500 | $526,200 |
| 2022 | $3,796 | $603,300 | $57,400 | $545,900 |
| 2021 | $3,427 | $465,600 | $57,400 | $408,200 |
| 2020 | $3,283 | $422,200 | $38,300 | $383,900 |
| 2019 | $3,184 | $398,800 | $36,200 | $362,600 |
| 2018 | $3,015 | $382,000 | $36,200 | $345,800 |
| 2017 | $3,055 | $372,000 | $36,200 | $335,800 |
| 2016 | $3,126 | $369,100 | $54,700 | $314,400 |
| 2015 | $2,347 | $272,400 | $53,000 | $219,400 |
| 2014 | -- | $192,400 | $51,400 | $141,000 |
Source: Public Records
Map
Nearby Homes
- 7309 S Union Village Cir
- 7218 S Viansa Ct
- 239 E 7350 S
- 7187 S 420 E
- 7170 S 420 E
- 215 Carol Way
- 7377 S Ramanee Dr
- 7080 S 230 E
- 529 E 7215 S Unit 9
- 210 Greenwood Ave Unit 102
- 7436 S Launa St
- 220 E Greenwood Ave
- 550 E Villager Ln
- 112 E 7420 S
- 7340 S 90 E
- 235 E 7615 S
- 7045 S 65 E
- 7359 S Dewmar Ct W Unit 32
- 7352 S Dewmar Ct W Unit 43
- 7367 S Dewmar Ct W Unit 34
- 7259 S Viansa Ct Unit 24
- 7271 S Viansa Ct Unit 22
- 7253 S Viansa Ct Unit 25
- 7253 S Viansa Ct
- 7277 S Viansa Ct Unit 21
- 7283 S Viansa Ct
- 7283 S Viansa Ct Unit LOT 20
- 7266 S Viansa Ct
- 7266 S Viansa Ct Unit 11
- 7260 S Viansa Ct Unit 10
- 7274 S Viansa Ct Unit 12
- 7274 S Viansa Ct
- 7256 S Viansa Ct Unit 9
- 7278 S Viansa Ct Unit 13
- 7278 S Viansa Ct
- 7241 S Viansa Ct
- 7241 S Viansa Ct Unit 48
- 7241 S Viansa Ct
- 7284 S Viansa Ct Unit 14
- 7252 S Viansa Ct Unit 8