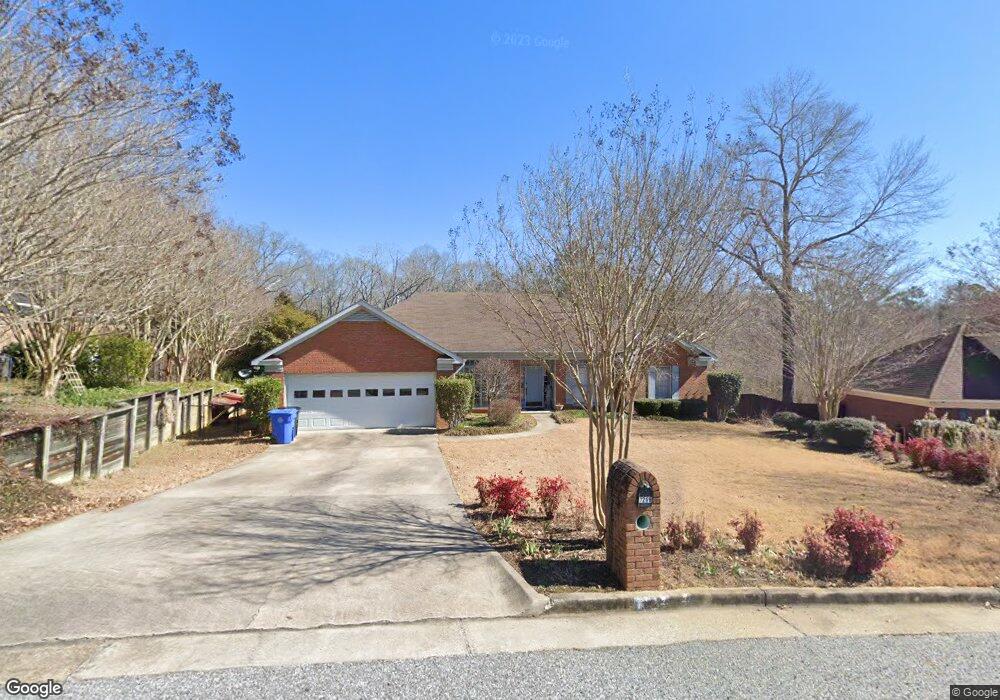
7269 Westport Loop Midland, GA 31820
Midland NeighborhoodEstimated Value: $318,006 - $377,000
4
Beds
3
Baths
2,311
Sq Ft
$149/Sq Ft
Est. Value
About This Home
This home is located at 7269 Westport Loop, Midland, GA 31820 and is currently estimated at $345,252, approximately $149 per square foot. 7269 Westport Loop is a home located in Muscogee County with nearby schools including Mathews Elementary School, Aaron Cohn Middle School, and Shaw High School.
Ownership History
Date
Name
Owned For
Owner Type
Purchase Details
Closed on
Oct 11, 2013
Sold by
Vernie Robert L
Bought by
Baum David and Baum Ann Marie
Current Estimated Value
Home Financials for this Owner
Home Financials are based on the most recent Mortgage that was taken out on this home.
Original Mortgage
$200,000
Outstanding Balance
$150,692
Interest Rate
4.57%
Mortgage Type
VA
Estimated Equity
$194,560
Purchase Details
Closed on
Feb 19, 2010
Sold by
Gmac Mortgage Llc
Bought by
Vernie Robert L
Home Financials for this Owner
Home Financials are based on the most recent Mortgage that was taken out on this home.
Original Mortgage
$191,105
Interest Rate
5.07%
Mortgage Type
VA
Purchase Details
Closed on
Sep 1, 2009
Sold by
Perez Marsha and Perez Ricky A
Bought by
Gmac Mortgage Llc
Create a Home Valuation Report for This Property
The Home Valuation Report is an in-depth analysis detailing your home's value as well as a comparison with similar homes in the area
Home Values in the Area
Average Home Value in this Area
Purchase History
| Date | Buyer | Sale Price | Title Company |
|---|---|---|---|
| Baum David | $206,000 | -- | |
| Vernie Robert L | $185,000 | None Available | |
| Gmac Mortgage Llc | $209,377 | None Available |
Source: Public Records
Mortgage History
| Date | Status | Borrower | Loan Amount |
|---|---|---|---|
| Open | Baum David | $200,000 | |
| Previous Owner | Vernie Robert L | $191,105 |
Source: Public Records
Tax History
| Year | Tax Paid | Tax Assessment Tax Assessment Total Assessment is a certain percentage of the fair market value that is determined by local assessors to be the total taxable value of land and additions on the property. | Land | Improvement |
|---|---|---|---|---|
| 2025 | $2,710 | $111,016 | $19,248 | $91,768 |
| 2024 | $2,708 | $111,016 | $19,248 | $91,768 |
| 2023 | $2,031 | $111,016 | $19,248 | $91,768 |
| 2022 | $2,825 | $91,416 | $19,248 | $72,168 |
| 2021 | $2,818 | $90,608 | $19,248 | $71,360 |
| 2020 | $2,819 | $90,608 | $19,248 | $71,360 |
| 2019 | $2,829 | $90,608 | $19,248 | $71,360 |
| 2018 | $2,829 | $90,608 | $19,248 | $71,360 |
| 2017 | $2,840 | $90,608 | $19,248 | $71,360 |
| 2016 | $2,852 | $82,401 | $13,776 | $68,625 |
| 2015 | $2,856 | $82,401 | $13,776 | $68,625 |
| 2014 | $2,860 | $82,401 | $13,776 | $68,625 |
| 2013 | -- | $96,290 | $13,776 | $82,514 |
Source: Public Records
Map
Nearby Homes
- 7240 Westport Loop
- 6055 Psalmond Rd
- 6389 Shagbark Ln
- 7170 Beaver Run Rd
- 7380 Macon Rd
- 7310 Macon Rd
- 6925 Pebble Ct
- 5717 Flat Rock Rd
- 6601 Psalmond Rd
- 6831 Beaver Trail
- 7101 Cross Tie Dr
- 7048 Widgeon Dr
- 5422 Brookview Dr
- 5434 Rockhurst Dr
- 6236 Olde Towne Dr
- 6215 Parker Dr
- 5912 Big Oak Dr
- 7378 San Vista Dr
- 6502 Tidewater Ct
- 9020 Scottsdale Ct
- 7277 Westport Loop
- 7263 Westport Loop
- 7285 Westport Loop
- 7259 Westport Loop
- 7262 Westport Loop
- 7293 Westport Loop
- 7256 Westport Loop
- 7257 Westport Loop
- 7278 Westport Loop
- 7320 E Wynfield Loop
- 7321 E Wynfield Loop
- 7301 Westport Loop
- 7222 Westport Ct
- 7286 Westport Loop
- 7252 Westport Loop
- 7253 Westport Loop
- 7223 Westport Ct
- 7317 E Wynfield Loop
- 7244 Westport Loop
- 7294 Westport Loop
Your Personal Tour Guide
Ask me questions while you tour the home.