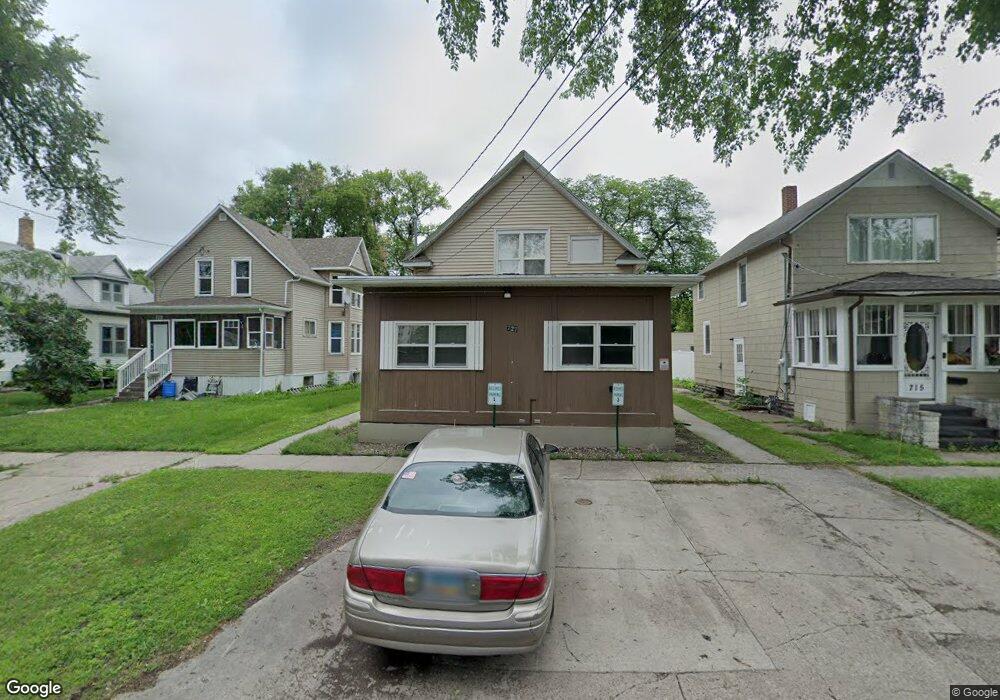
727 3rd St N Unit 1-5 Fargo, ND 58102
Horace Mann NeighborhoodEstimated Value: $273,000 - $333,000
--
Bed
--
Bath
2,070
Sq Ft
$149/Sq Ft
Est. Value
About This Home
This home is located at 727 3rd St N Unit 1-5, Fargo, ND 58102 and is currently estimated at $308,162, approximately $148 per square foot. 727 3rd St N Unit 1-5 is a home located in Cass County with nearby schools including Horace Mann Roosevelt Elementary School, Ben Franklin Middle School, and North High School.
Ownership History
Date
Name
Owned For
Owner Type
Purchase Details
Closed on
May 5, 2023
Sold by
Hdm Properties Llc
Bought by
Par Properties Llc
Current Estimated Value
Purchase Details
Closed on
Aug 21, 2015
Sold by
Jh & Jh Rentals Llc
Bought by
Hdm Properties Llc
Purchase Details
Closed on
Jul 10, 2012
Sold by
Hanson Harland W and Hanson Alice A
Bought by
Jill & Jh Rentals Llc
Create a Home Valuation Report for This Property
The Home Valuation Report is an in-depth analysis detailing your home's value as well as a comparison with similar homes in the area
Home Values in the Area
Average Home Value in this Area
Purchase History
| Date | Buyer | Sale Price | Title Company |
|---|---|---|---|
| Par Properties Llc | $272,500 | Title Company-Residential | |
| Hdm Properties Llc | -- | Title Co | |
| Jill & Jh Rentals Llc | $92,000 | Fm Title |
Source: Public Records
Tax History Compared to Growth
Tax History
| Year | Tax Paid | Tax Assessment Tax Assessment Total Assessment is a certain percentage of the fair market value that is determined by local assessors to be the total taxable value of land and additions on the property. | Land | Improvement |
|---|---|---|---|---|
| 2024 | $5,547 | $154,050 | $13,650 | $140,400 |
| 2023 | $5,310 | $147,450 | $13,650 | $133,800 |
| 2022 | $4,855 | $128,600 | $13,650 | $114,950 |
| 2021 | $4,798 | $127,500 | $13,650 | $113,850 |
| 2020 | $4,745 | $127,500 | $13,650 | $113,850 |
| 2019 | $4,834 | $129,000 | $9,700 | $119,300 |
| 2018 | $4,825 | $131,400 | $9,700 | $121,700 |
| 2017 | $4,118 | $110,150 | $5,700 | $104,450 |
| 2014 | $3,357 | $77,650 | $5,450 | $72,200 |
Source: Public Records
Map
Nearby Homes
- 609 3rd St N
- 113 6th Ave N
- 901 3rd St N
- 726 Oak St N
- 51 6th Ave N
- 727 Oak St N
- 730 Elm St N Unit B1
- 412 5th St N Unit 506
- 412 5th St N Unit 526
- 412 5th St N Unit 508
- 915 Broadway N
- 200 4th Ave N Unit 201
- 200 4th Ave N Unit 102
- 505 Oak St N Unit 503
- 505 Oak St N Unit 501
- 611 9th Ave N
- 722 7th St N
- 724 7th St N
- 1103 2nd St N
- 624 10th Ave N