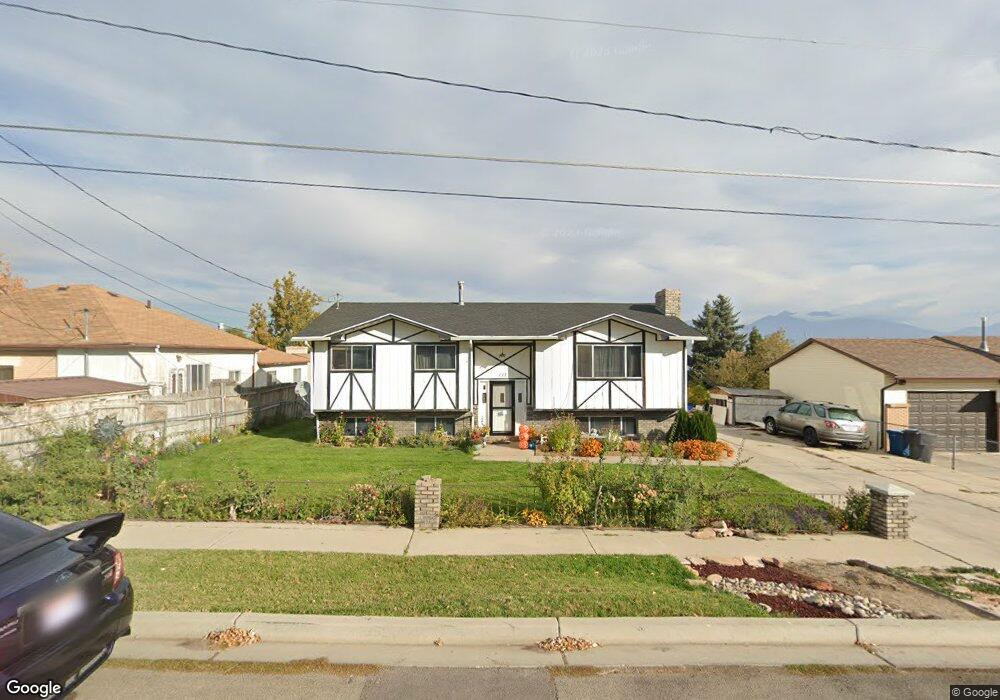
727 E 200 S Payson, UT 84651
Estimated Value: $430,000 - $462,000
3
Beds
3
Baths
1,218
Sq Ft
$361/Sq Ft
Est. Value
About This Home
This home is located at 727 E 200 S, Payson, UT 84651 and is currently estimated at $439,338, approximately $360 per square foot. 727 E 200 S is a home located in Utah County with nearby schools including Barnett Elementary School, Salem Junior High School, and Valley View Middle School.
Ownership History
Date
Name
Owned For
Owner Type
Purchase Details
Closed on
Apr 22, 2010
Sold by
Avila Oscar
Bought by
Salazar Rosa Maria
Current Estimated Value
Purchase Details
Closed on
Oct 16, 2009
Sold by
Avila Maria Magdalena
Bought by
Avila Oscar
Purchase Details
Closed on
May 11, 2005
Sold by
Govea Maria F and Cloward Maria F
Bought by
Avila Maria Magdalena
Purchase Details
Closed on
Dec 7, 2001
Sold by
Cloward Maria F and Salazar Maria Flora
Bought by
Cloward Maria F
Purchase Details
Closed on
Jul 5, 2001
Sold by
Salazar Geraldo
Bought by
Salazar Maria Flora
Create a Home Valuation Report for This Property
The Home Valuation Report is an in-depth analysis detailing your home's value as well as a comparison with similar homes in the area
Home Values in the Area
Average Home Value in this Area
Purchase History
| Date | Buyer | Sale Price | Title Company |
|---|---|---|---|
| Salazar Rosa Maria | -- | None Available | |
| Avila Oscar | -- | None Available | |
| Avila Maria Magdalena | -- | -- | |
| Cloward Maria F | -- | -- | |
| Salazar Maria Flora | -- | -- |
Source: Public Records
Tax History
| Year | Tax Paid | Tax Assessment Tax Assessment Total Assessment is a certain percentage of the fair market value that is determined by local assessors to be the total taxable value of land and additions on the property. | Land | Improvement |
|---|---|---|---|---|
| 2025 | $1,954 | $218,185 | -- | -- |
| 2024 | $1,954 | $198,880 | $0 | $0 |
| 2023 | $1,938 | $197,780 | $0 | $0 |
| 2022 | $2,093 | $210,045 | $0 | $0 |
| 2021 | $1,733 | $279,000 | $83,900 | $195,100 |
| 2020 | $1,655 | $260,700 | $76,300 | $184,400 |
| 2019 | $1,404 | $226,700 | $65,900 | $160,800 |
| 2018 | $1,293 | $201,200 | $55,500 | $145,700 |
| 2017 | $1,183 | $99,055 | $0 | $0 |
| 2016 | $1,138 | $94,655 | $0 | $0 |
| 2015 | $752 | $82,720 | $0 | $0 |
| 2014 | $953 | $79,255 | $0 | $0 |
Source: Public Records
Map
Nearby Homes
Your Personal Tour Guide
Ask me questions while you tour the home.