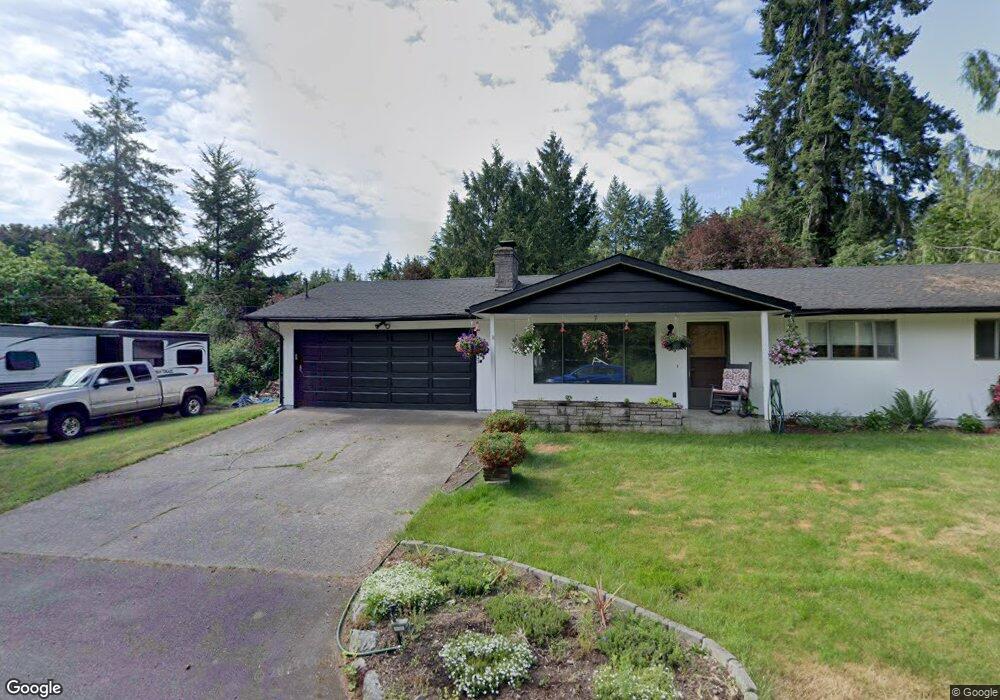
727 Euclid Ave Shelton, WA 98584
Estimated Value: $341,000 - $367,000
3
Beds
2
Baths
1,252
Sq Ft
$284/Sq Ft
Est. Value
About This Home
This home is located at 727 Euclid Ave, Shelton, WA 98584 and is currently estimated at $355,945, approximately $284 per square foot. 727 Euclid Ave is a home located in Mason County with nearby schools including Bordeaux Elementary School, Olympic Middle School, and Oakland Bay Junior High School.
Ownership History
Date
Name
Owned For
Owner Type
Purchase Details
Closed on
Jul 16, 2021
Sold by
Parson Bradley J and Sparhawk Patricia M
Bought by
Parson Bradley J and Parson Patricia M
Current Estimated Value
Purchase Details
Closed on
Sep 30, 2020
Sold by
Wilson Julie T
Bought by
Parson Bradley J and Sparhawk Patricia M
Home Financials for this Owner
Home Financials are based on the most recent Mortgage that was taken out on this home.
Original Mortgage
$263,145
Outstanding Balance
$233,524
Interest Rate
2.9%
Mortgage Type
FHA
Estimated Equity
$122,421
Purchase Details
Closed on
Jul 23, 2009
Sold by
Harms Sharon L
Bought by
Wilson Julie T
Home Financials for this Owner
Home Financials are based on the most recent Mortgage that was taken out on this home.
Original Mortgage
$150,228
Interest Rate
5.31%
Mortgage Type
FHA
Create a Home Valuation Report for This Property
The Home Valuation Report is an in-depth analysis detailing your home's value as well as a comparison with similar homes in the area
Home Values in the Area
Average Home Value in this Area
Purchase History
| Date | Buyer | Sale Price | Title Company |
|---|---|---|---|
| Parson Bradley J | -- | None Available | |
| Parson Bradley J | -- | None Available | |
| Parson Bradley J | $4,288,000 | Land Title | |
| Wilson Julie T | $153,000 | None Available |
Source: Public Records
Mortgage History
| Date | Status | Borrower | Loan Amount |
|---|---|---|---|
| Open | Parson Bradley J | $263,145 | |
| Previous Owner | Wilson Julie T | $150,228 | |
| Closed | Parson Bradley J | $10,525 |
Source: Public Records
Tax History Compared to Growth
Tax History
| Year | Tax Paid | Tax Assessment Tax Assessment Total Assessment is a certain percentage of the fair market value that is determined by local assessors to be the total taxable value of land and additions on the property. | Land | Improvement |
|---|---|---|---|---|
| 2025 | $2,624 | $268,725 | $45,365 | $223,360 |
| 2023 | $2,624 | $295,510 | $38,185 | $257,325 |
| 2022 | $2,761 | $220,810 | $36,025 | $184,785 |
| 2021 | $2,696 | $220,810 | $36,025 | $184,785 |
| 2020 | $2,423 | $198,860 | $39,155 | $159,705 |
| 2018 | $2,858 | $171,095 | $79,690 | $91,405 |
| 2017 | $2,453 | $171,095 | $79,690 | $91,405 |
| 2016 | $2,412 | $158,850 | $79,690 | $79,160 |
| 2015 | $2,361 | $158,850 | $79,690 | $79,160 |
| 2014 | -- | $153,345 | $75,000 | $78,345 |
| 2013 | -- | $149,475 | $70,315 | $79,160 |
Source: Public Records
Map
Nearby Homes
- 725 W Wyandotte Ave
- 506 -630 W Harvard Ave
- 629 Turner Ave
- 212 Euclid Ave
- 630 May Ave
- 210 Seattle Ave
- 505 S 8th St
- 716 Meridian Ave
- 928 Olympic Ave
- 0 Lots 1-83 Harvard Turner Ave W
- 218 Park St
- 202 Park St
- 2005 Lake Blvd
- 102 Park St
- 0 Xxx E Thornton Rd
- 0 Xxx Unit NWM2420430
- 126 Hawthorn Ln
- 2230 Beverly Blvd
- 428 Ellinor Ave
- 435 Fairmount Ave
- 801 Euclid Ave
- 728 W Wyandotte Ave
- 722 W Wyandotte Ave
- 1205 S 7th St
- 802 W Wyandotte Ave
- 718 Euclid Ave
- 1223 S 7th St
- 704 Euclid Ave
- 810 W Wyandotte Ave
- 812 Euclid Ave
- 815 Euclid Ave
- 0 Euclid Ave
- 1107 S 7th St
- 1109 S 7th St
- 823 Euclid Ave
- 1208 S 7th St
- 715 W Wyandotte Ave
- 826 W Wyandotte Ave
- 1224 S 7th St