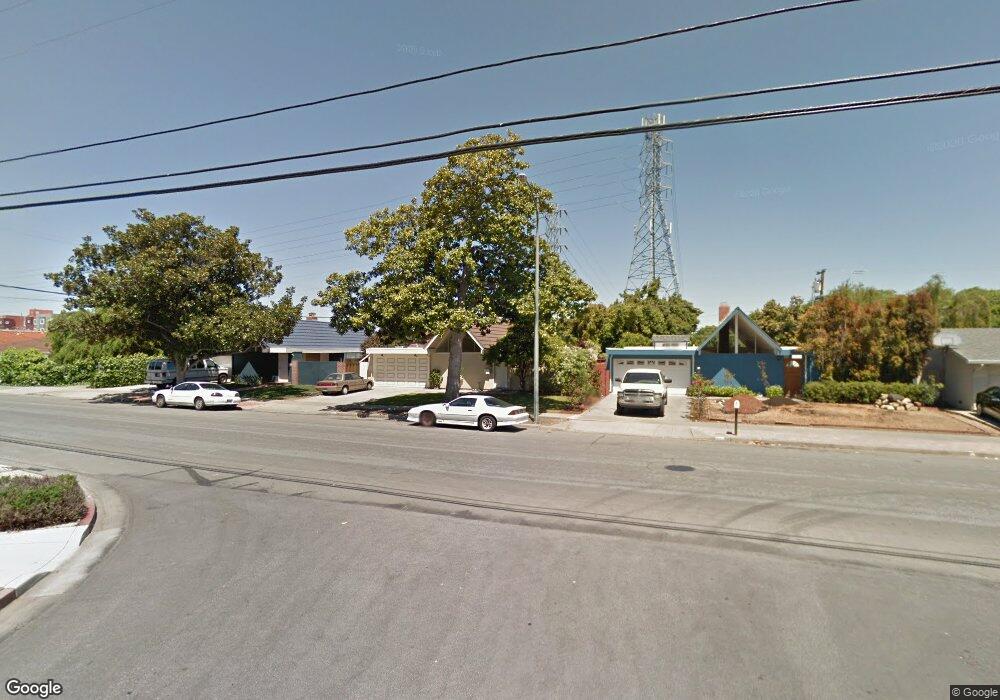
727 Iris Ave Sunnyvale, CA 94086
Ponderosa Park NeighborhoodEstimated Value: $2,119,000 - $2,464,000
About This Home
This home is located at 727 Iris Ave, Sunnyvale, CA 94086 and is currently estimated at $2,349,274, approximately $1,639 per square foot. 727 Iris Ave is a home located in Santa Clara County with nearby schools including Braly Elementary School, Marian A. Peterson Middle School, and Adrian Wilcox High School.
Ownership History
We collect this data history from publicly available records. To have your information removed, we recommend requesting removal directly through your county’s website.
Purchase Details
Home Financials for this Owner
Home Financials are based on the most recent Mortgage that was taken out on this home.Purchase Details
Home Financials for this Owner
Home Financials are based on the most recent Mortgage that was taken out on this home.Purchase Details
Home Financials for this Owner
Home Financials are based on the most recent Mortgage that was taken out on this home.Purchase Details
Purchase Details
Home Financials for this Owner
Home Financials are based on the most recent Mortgage that was taken out on this home.Purchase Details
Purchase Details
Home Financials for this Owner
Home Financials are based on the most recent Mortgage that was taken out on this home.Purchase Details
Home Financials for this Owner
Home Financials are based on the most recent Mortgage that was taken out on this home.Purchase Details
Home Financials for this Owner
Home Financials are based on the most recent Mortgage that was taken out on this home.Home Values in the Area
Average Home Value in this Area
Purchase History
We collect this data history from publicly available records. To have your information removed, we recommend requesting removal directly through your county’s website.
| Date | Buyer | Sale Price | Title Company |
|---|---|---|---|
| -- | Chicago Title | ||
| -- | Chicago Title | ||
| -- | North American Er | ||
| -- | North American Title Co Inc | ||
| -- | North American Title | ||
| -- | North American Title Co Inc | ||
| -- | None Available | ||
| -- | None Available | ||
| -- | Fidelity Natl Title Co Of Ca | ||
| -- | Fidelity Natl Title Co Of Ca | ||
| -- | None Available | ||
| -- | Financial Title Company | ||
| $470,000 | Financial Title Company | ||
| $225,000 | Fidelity National Title Ins |
Mortgage History
We collect this data history from publicly available records. To have your information removed, we recommend requesting removal directly through your county’s website.
| Date | Status | Borrower | Loan Amount |
|---|---|---|---|
| Open | $389,000 | ||
| Previous Owner | $414,000 | ||
| Previous Owner | $417,000 | ||
| Previous Owner | $106,000 | ||
| Previous Owner | $158,000 | ||
| Previous Owner | $160,000 | ||
| Previous Owner | $202,275 |
Tax History
We collect this data history from publicly available records. To have your information removed, we recommend requesting removal directly through your county’s website.
| Year | Tax Paid | Tax Assessment Tax Assessment Total Assessment is a certain percentage of the fair market value that is determined by local assessors to be the total taxable value of land and additions on the property. | Land | Improvement |
|---|---|---|---|---|
| 2025 | $9,728 | $843,975 | $528,199 | $315,776 |
| 2024 | $9,728 | $827,428 | $517,843 | $309,585 |
| 2023 | $9,629 | $811,205 | $507,690 | $303,515 |
| 2022 | $9,469 | $795,300 | $497,736 | $297,564 |
| 2021 | $9,433 | $779,707 | $487,977 | $291,730 |
| 2020 | $9,261 | $771,713 | $482,974 | $288,739 |
| 2019 | $9,250 | $756,582 | $473,504 | $283,078 |
| 2018 | $8,656 | $741,748 | $464,220 | $277,528 |
| 2017 | $8,607 | $727,205 | $455,118 | $272,087 |
| 2016 | $8,428 | $712,947 | $446,195 | $266,752 |
| 2015 | $8,397 | $702,239 | $439,493 | $262,746 |
| 2014 | $7,996 | $688,484 | $430,884 | $257,600 |
Map
- 744 Jackpine Ct
- 631 E El Camino Real Unit 102
- 626 S Fair Oaks Ave
- 618 S Fair Oaks Ave Unit 46
- 750 Calla Dr
- 869 Lusterleaf Dr
- 831 Mangrove Ave
- 922 Noble Fir Terrace Unit 5
- 466 Wilson Ave
- 963 Bellomo Ave
- 771 Ajax Dr
- 918 Mangrove Ave
- 945 Reed Ave
- 901 Sunnyvale Saratoga Rd
- 1229 Picasso Dr
- 759 E Evelyn Ave
- 585 Bryan Ave
- 428 Crescent Ave
- 458 Pin Oak Dr
- 1249 Crescent Terrace Unit 2
- 697 Iris Ave Unit B
- 697 Iris Ave
- 691 Iris Ave
- 723 Iris Ave
- 698 Iris Ave
- 677 Iris Ave
- 701 Jackpine Ct
- 731 Iris Ave
- 710 Golden Oak Dr
- 708 Golden Oak Dr
- 707 Jackpine Ct
- 678 Iris Ave
- 735 Iris Ave
- 713 Jackpine Ct
- 716 Golden Oak Dr
- 672 Iris Ave
- 741 Iris Ave
- 702 Jackpine Ct
- 708 Jackpine Ct
- 666 Iris Ave Unit 1
Ask me questions while you tour the home.