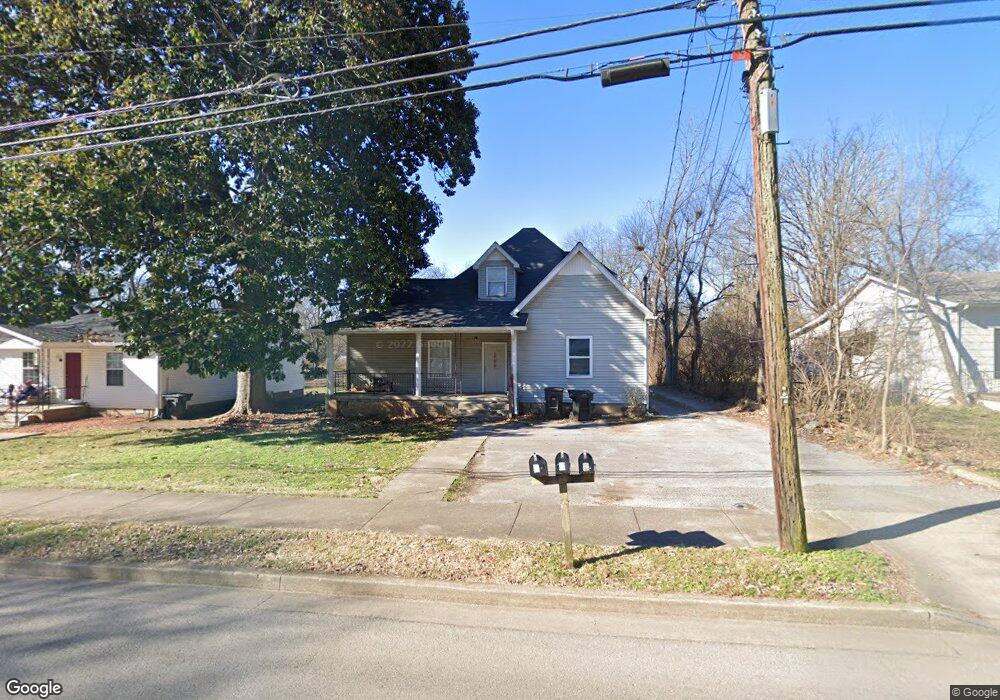
727 N Maple St Murfreesboro, TN 37130
Estimated Value: $321,000 - $484,000
Studio
3
Baths
2,038
Sq Ft
$194/Sq Ft
Est. Value
About This Home
This home is located at 727 N Maple St, Murfreesboro, TN 37130 and is currently estimated at $394,667, approximately $193 per square foot. 727 N Maple St is a home located in Rutherford County with nearby schools including Mitchell-Neilson Elementary, Siegel Middle School, and Siegel High School.
Ownership History
Date
Name
Owned For
Owner Type
Purchase Details
Closed on
Feb 28, 2022
Sold by
Lee David A and Lee Lynnette P
Bought by
Tennessee State Home Buyers Llc
Current Estimated Value
Purchase Details
Closed on
Feb 18, 2022
Sold by
Music City Holdings Llc
Bought by
Beach Joseph Clay and Beach Paula Annette
Purchase Details
Closed on
Jun 26, 2006
Sold by
Rhonda Stansbury
Bought by
Lee David A and Lee Lynnette P
Purchase Details
Closed on
Jun 16, 2006
Sold by
Lee David A and Lee Lynnette P
Bought by
Rhonda Stansberry
Purchase Details
Closed on
May 30, 2006
Sold by
Carey Tolbert
Bought by
Lee David A and Lee Lynnette P
Purchase Details
Closed on
Feb 13, 2006
Sold by
Lee Cavid A
Bought by
Lee David A and Lee Lynnette P
Purchase Details
Closed on
Jan 7, 2006
Sold by
Ford Patterson
Bought by
Taylor Coleman
Create a Home Valuation Report for This Property
The Home Valuation Report is an in-depth analysis detailing your home's value as well as a comparison with similar homes in the area
Home Values in the Area
Average Home Value in this Area
Purchase History
| Date | Buyer | Sale Price | Title Company |
|---|---|---|---|
| Tennessee State Home Buyers Llc | $258,000 | Lawyers Land & Title | |
| Beach Joseph Clay | $335,000 | Concord Title | |
| Music City Holdings Llc | $322,000 | Rudy Title | |
| Rockwood Builders And Restoration | $275,000 | Lawyers Land & Title | |
| Lee David A | -- | -- | |
| Rhonda Stansberry | -- | -- | |
| Lee David A | -- | -- | |
| Lee David A | -- | -- | |
| Lee David A | -- | -- | |
| Lee David A | -- | -- | |
| Lee David A | -- | -- | |
| Carey Tolbert | -- | -- | |
| Taylor Coleman | -- | -- | |
| Lee Lynnette P | -- | -- | |
| Betty Haygood | -- | -- | |
| Lee David A | -- | -- | |
| Lee Jennifer M | -- | -- |
Source: Public Records
Tax History
| Year | Tax Paid | Tax Assessment Tax Assessment Total Assessment is a certain percentage of the fair market value that is determined by local assessors to be the total taxable value of land and additions on the property. | Land | Improvement |
|---|---|---|---|---|
| 2025 | $3,300 | $116,680 | $21,000 | $95,680 |
| 2024 | $3,300 | $116,680 | $21,000 | $95,680 |
| 2023 | $2,194 | $116,960 | $21,000 | $95,960 |
| 2022 | $1,890 | $116,960 | $21,000 | $95,960 |
| 2021 | $1,403 | $63,200 | $14,000 | $49,200 |
| 2020 | $1,403 | $63,200 | $14,000 | $49,200 |
| 2019 | $1,403 | $63,200 | $14,000 | $49,200 |
| 2018 | $1,927 | $63,200 | $0 | $0 |
| 2017 | $1,601 | $41,200 | $0 | $0 |
| 2016 | $1,601 | $41,200 | $0 | $0 |
| 2015 | $1,601 | $41,200 | $0 | $0 |
| 2014 | $1,025 | $41,200 | $0 | $0 |
| 2013 | -- | $41,360 | $0 | $0 |
Source: Public Records
Map
Nearby Homes
- 807 N Maple St
- 718 N Walnut St
- 904 N Maple St
- 520 N Maple St Unit 3
- 520 N Maple St Unit 2
- 520 N Maple St Unit 1
- 513 N Maple St
- 1019 N Maple St Unit 2B
- 1022 Poplar Ave
- 515 N Academy St Unit 517
- 412 N Church St
- 422 N Academy St
- 418 Lynn St
- 1212 N Spring St
- 534 N Maney Ave
- 225 N Academy St
- 520 W College St
- 1107 Owen Layne Dr
- 1018 Owen Layne Dr
- 1132 Owen Layne Dr
- 727 N Maple St Unit A
- 723 N Maple St
- 721 N Maple St
- 721 N Maple St Unit C
- 721 N Maple St Unit B
- 717 N Maple St
- 811 N Maple St
- 718 N Maple St
- 714 N Maple St
- 724 N Walnut St
- 712 N Maple St
- 711 N Maple St
- 711 N Maple St Unit B
- 804 N Maple St
- 710 N Maple St Unit C
- 710 N Maple St
- 710 N Maple St Unit A
- 710 N Maple St
- 728 N Walnut St
- 808 N Maple St
Your Personal Tour Guide
Ask me questions while you tour the home.