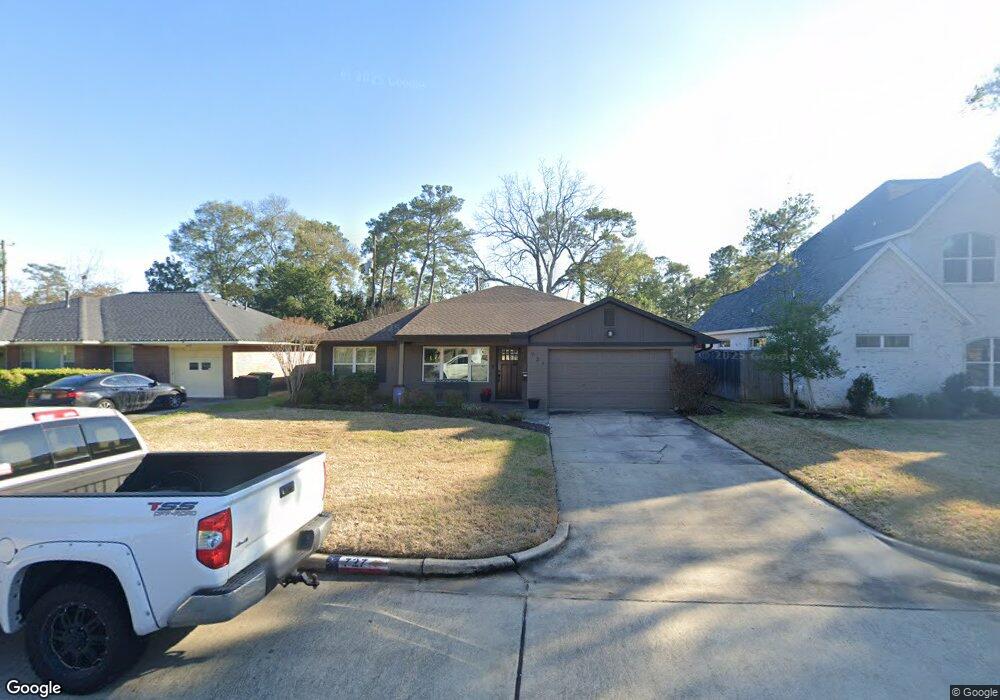
727 Sleepyvale Ln Houston, TX 77018
Oak Forest-Garden Oaks NeighborhoodEstimated Value: $607,000 - $770,000
2
Beds
2
Baths
1,260
Sq Ft
$545/Sq Ft
Est. Value
About This Home
This home is located at 727 Sleepyvale Ln, Houston, TX 77018 and is currently estimated at $687,050, approximately $545 per square foot. 727 Sleepyvale Ln is a home located in Harris County with nearby schools including Garden Oaks Montessori, Frank Black Middle School, and Waltrip High School.
Ownership History
Date
Name
Owned For
Owner Type
Purchase Details
Closed on
Nov 12, 2021
Sold by
Mahan Conner B and Mahan Jacqueline
Bought by
Bgrs Llc and Brookfield Global Relocation Svcs Llc
Current Estimated Value
Purchase Details
Closed on
Apr 22, 2013
Sold by
Hogg William Charles
Bought by
Hogg William Charles and Hogg Cristl C
Home Financials for this Owner
Home Financials are based on the most recent Mortgage that was taken out on this home.
Original Mortgage
$268,500
Interest Rate
3.67%
Mortgage Type
New Conventional
Purchase Details
Closed on
Feb 27, 2003
Sold by
Chow Ruth A
Bought by
Hogg William Charles
Home Financials for this Owner
Home Financials are based on the most recent Mortgage that was taken out on this home.
Original Mortgage
$126,000
Interest Rate
5.86%
Create a Home Valuation Report for This Property
The Home Valuation Report is an in-depth analysis detailing your home's value as well as a comparison with similar homes in the area
Home Values in the Area
Average Home Value in this Area
Purchase History
| Date | Buyer | Sale Price | Title Company |
|---|---|---|---|
| Bgrs Llc | -- | None Available | |
| Hogg William Charles | -- | First American Title | |
| Hogg William Charles | -- | First American Title |
Source: Public Records
Mortgage History
| Date | Status | Borrower | Loan Amount |
|---|---|---|---|
| Previous Owner | Hogg William Charles | $268,500 | |
| Previous Owner | Hogg William Charles | $126,000 | |
| Closed | Hogg William Charles | $23,625 |
Source: Public Records
Tax History Compared to Growth
Tax History
| Year | Tax Paid | Tax Assessment Tax Assessment Total Assessment is a certain percentage of the fair market value that is determined by local assessors to be the total taxable value of land and additions on the property. | Land | Improvement |
|---|---|---|---|---|
| 2025 | $9,808 | $630,887 | $403,620 | $227,267 |
| 2024 | $9,808 | $636,691 | $305,970 | $330,721 |
| 2023 | $9,808 | $580,598 | $260,400 | $320,198 |
| 2022 | $11,719 | $532,215 | $260,400 | $271,815 |
| 2021 | $12,036 | $520,719 | $260,400 | $260,319 |
| 2020 | $11,369 | $501,483 | $260,400 | $241,083 |
| 2019 | $10,800 | $486,710 | $162,750 | $323,960 |
| 2018 | $7,592 | $388,000 | $162,750 | $225,250 |
| 2017 | $9,811 | $388,000 | $162,750 | $225,250 |
| 2016 | $9,811 | $388,000 | $162,750 | $225,250 |
| 2015 | $6,477 | $448,000 | $162,750 | $285,250 |
| 2014 | $6,477 | $380,000 | $162,750 | $217,250 |
Source: Public Records
Map
Nearby Homes
- 739 Azaleadell Dr
- 702 Azaleadell Dr
- 535 Azaleadell Dr
- 814 Azalea St
- 4510 Curtin Park Ct
- 830 Azalea St
- 752 Curtin St
- 750 Curtin St
- 748 Curtin St
- 744 Curtin St
- 742 Curtin St
- 9388 Plan at Thornton Oaks
- 9384 Plan at Thornton Oaks
- 817 Thornton Rd Unit G
- 811 Thornton Rd Unit B
- 719 Thornton Rd Unit B
- 719 Thornton Rd Unit E
- 719 Thornton Rd Unit A
- 719 Thornton Rd Unit F
- 812 Thornton Rd Unit B
- 723 Sleepyvale Ln
- 731 Sleepyvale Ln
- 722 Azaleadell Dr
- 726 Azaleadell Dr
- 719 Sleepyvale Ln
- 718 Azaleadell Dr
- 726 Sleepyvale Ln
- 722 Sleepyvale Ln
- 730 Sleepyvale Ln
- 715 Sleepyvale Ln
- 714 Azaleadell Dr
- 716 Sleepyvale Ln
- 407 Azaleadell Dr
- 415 Azaleadell Dr
- 710 Azaleadell Dr
- 419 Azaleadell Dr
- 403 Azaleadell Dr
- 506 Azaleadell Dr
- 727 Azaleadell Dr
- 510 Azaleadell Dr