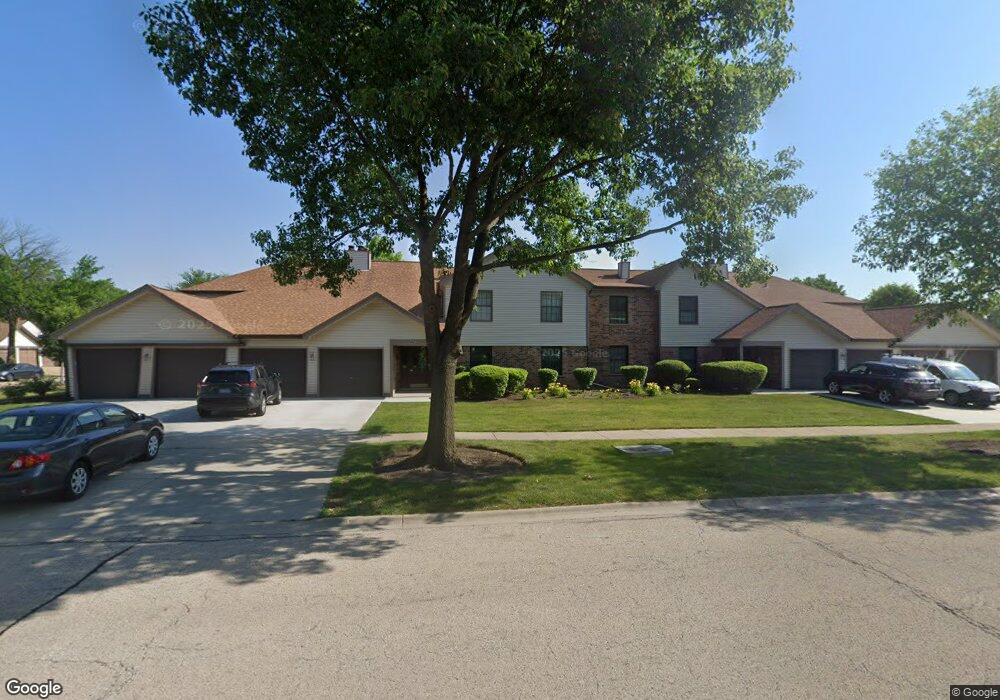
727 Weidner Rd Unit 14SC2 Buffalo Grove, IL 60089
South Buffalo Grove NeighborhoodEstimated Value: $231,178 - $255,000
2
Beds
--
Bath
1,000
Sq Ft
$244/Sq Ft
Est. Value
About This Home
This home is located at 727 Weidner Rd Unit 14SC2, Buffalo Grove, IL 60089 and is currently estimated at $243,545, approximately $243 per square foot. 727 Weidner Rd Unit 14SC2 is a home located in Cook County with nearby schools including Henry W Longfellow Elementary School, Cooper Middle School, and Buffalo Grove High School.
Ownership History
Date
Name
Owned For
Owner Type
Purchase Details
Closed on
Jul 11, 2025
Sold by
Stadler Susanne and Laiser Moshe K
Bought by
Moshe K Laiser And Susanne H Laiser Declarati and Laiser
Current Estimated Value
Purchase Details
Closed on
May 29, 2002
Sold by
Weaver Scott C
Bought by
Stadler Susanne
Home Financials for this Owner
Home Financials are based on the most recent Mortgage that was taken out on this home.
Original Mortgage
$142,500
Interest Rate
6.95%
Purchase Details
Closed on
Aug 10, 1995
Sold by
Wilson Dianna J
Bought by
Weaver Scott C
Home Financials for this Owner
Home Financials are based on the most recent Mortgage that was taken out on this home.
Original Mortgage
$101,850
Interest Rate
7.51%
Mortgage Type
FHA
Create a Home Valuation Report for This Property
The Home Valuation Report is an in-depth analysis detailing your home's value as well as a comparison with similar homes in the area
Home Values in the Area
Average Home Value in this Area
Purchase History
| Date | Buyer | Sale Price | Title Company |
|---|---|---|---|
| Moshe K Laiser And Susanne H Laiser Declarati | -- | None Listed On Document | |
| Moshe K Laiser And Susanne H Laiser Declarati | -- | None Listed On Document | |
| Stadler Susanne | $150,000 | -- | |
| Weaver Scott C | $105,000 | -- |
Source: Public Records
Mortgage History
| Date | Status | Borrower | Loan Amount |
|---|---|---|---|
| Previous Owner | Stadler Susanne | $142,500 | |
| Previous Owner | Weaver Scott C | $101,850 |
Source: Public Records
Tax History Compared to Growth
Tax History
| Year | Tax Paid | Tax Assessment Tax Assessment Total Assessment is a certain percentage of the fair market value that is determined by local assessors to be the total taxable value of land and additions on the property. | Land | Improvement |
|---|---|---|---|---|
| 2024 | $968 | $15,758 | $2,332 | $13,426 |
| 2023 | $961 | $15,758 | $2,332 | $13,426 |
| 2022 | $961 | $15,758 | $2,332 | $13,426 |
| 2021 | $1,074 | $12,828 | $323 | $12,505 |
| 2020 | $973 | $12,828 | $323 | $12,505 |
| 2019 | $969 | $14,214 | $323 | $13,891 |
| 2018 | $1,550 | $11,372 | $259 | $11,113 |
| 2017 | $1,041 | $11,372 | $259 | $11,113 |
| 2016 | $1,695 | $11,372 | $259 | $11,113 |
| 2015 | $1,926 | $10,463 | $1,101 | $9,362 |
| 2014 | $1,854 | $10,463 | $1,101 | $9,362 |
| 2013 | $1,259 | $10,463 | $1,101 | $9,362 |
Source: Public Records
Map
Nearby Homes
- 813 Stradford Cir Unit 21B2
- 780 Weidner Rd Unit 300
- 820 Weidner Rd Unit 409
- 859 Beechwood Rd
- 720 Weidner Rd Unit 302
- 535 Estate Dr
- 410 Chatham Cir
- 408 Indian Hill Dr
- 921 Bernard Dr
- 1115 Miller Ln Unit 104
- 18 E Heritage Ct
- 329 Timber Hill Rd
- 1127 Miller Ln Unit 107
- 972 Thornton Ln Unit 102
- 3300 N Carriageway Dr Unit 317
- 455 Mayfair Ln
- 1149 Miller Ln Unit 107
- 3227 N Heritage Ln
- 705 Grove Dr Unit 101
- 3222 N Heritage Ln
- 721 Weidner Rd Unit 14SD1
- 723 Weidner Rd Unit 14SD2
- 725 Weidner Rd Unit 14SC1
- 733 Weidner Rd Unit 14SB2
- 735 Weidner Rd Unit 14SA1
- 731 Weidner Rd Unit 14SB1
- 737 Weidner Rd Unit 14SA2
- 822 Stradford Cir Unit 14ND1
- 824 Stradford Cir Unit 14ND2
- 801 Stradford Cir Unit 21A3
- 826 Stradford Cir Unit 14NC1
- 803 Stradford Cir Unit 21A4
- 805 Stradford Cir Unit 21C1
- 807 Stradford Cir Unit 21C2
- 807 Stradford Cir Unit 807
- 828 Stradford Cir Unit 14NC2
- 811 Stradford Cir Unit 21B1
- 811 Stradford Cir
- 815 Stradford Cir Unit 21A1
- 832 Stradford Cir Unit 14NB1