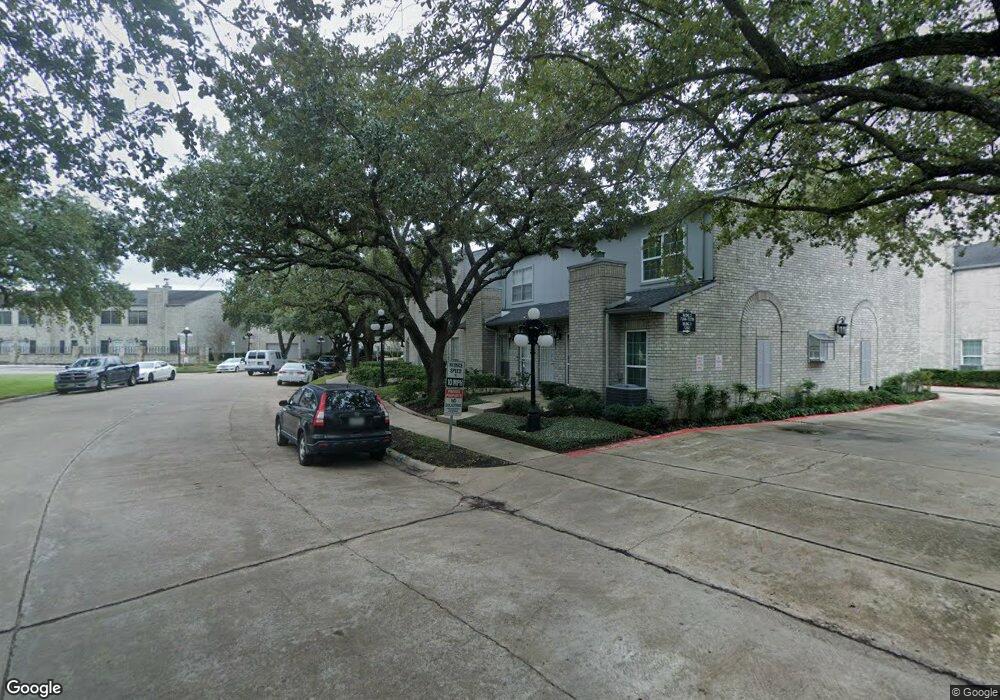
7270 Regency Square Ct Unit 7270 Houston, TX 77036
Sharpstown NeighborhoodEstimated Value: $151,000 - $166,000
2
Beds
3
Baths
1,470
Sq Ft
$110/Sq Ft
Est. Value
About This Home
This home is located at 7270 Regency Square Ct Unit 7270, Houston, TX 77036 and is currently estimated at $161,640, approximately $109 per square foot. 7270 Regency Square Ct Unit 7270 is a home located in Harris County with nearby schools including Piney Point Elementary School, Paul Revere Middle School, and Wisdom High School.
Ownership History
Date
Name
Owned For
Owner Type
Purchase Details
Closed on
Jun 26, 2017
Sold by
Scanlan Darrell Gene
Bought by
Paul Carivin T
Current Estimated Value
Home Financials for this Owner
Home Financials are based on the most recent Mortgage that was taken out on this home.
Original Mortgage
$122,735
Outstanding Balance
$102,334
Interest Rate
4.02%
Mortgage Type
FHA
Estimated Equity
$59,306
Purchase Details
Closed on
Sep 29, 1993
Sold by
Reene Jeffrey C and Renee Kimberly B
Bought by
Scanlan John A
Home Financials for this Owner
Home Financials are based on the most recent Mortgage that was taken out on this home.
Original Mortgage
$43,200
Interest Rate
7.11%
Mortgage Type
Purchase Money Mortgage
Create a Home Valuation Report for This Property
The Home Valuation Report is an in-depth analysis detailing your home's value as well as a comparison with similar homes in the area
Home Values in the Area
Average Home Value in this Area
Purchase History
| Date | Buyer | Sale Price | Title Company |
|---|---|---|---|
| Paul Carivin T | -- | Momentum Title Llc | |
| Scanlan John A | -- | -- | |
| Scanlan John A | -- | -- |
Source: Public Records
Mortgage History
| Date | Status | Borrower | Loan Amount |
|---|---|---|---|
| Open | Paul Carivin T | $122,735 | |
| Previous Owner | Scanlan John A | $43,200 |
Source: Public Records
Tax History Compared to Growth
Tax History
| Year | Tax Paid | Tax Assessment Tax Assessment Total Assessment is a certain percentage of the fair market value that is determined by local assessors to be the total taxable value of land and additions on the property. | Land | Improvement |
|---|---|---|---|---|
| 2025 | $2,044 | $180,697 | $34,332 | $146,365 |
| 2024 | $2,044 | $180,697 | $34,332 | $146,365 |
| 2023 | $2,044 | $167,270 | $31,781 | $135,489 |
| 2022 | $3,276 | $143,546 | $27,274 | $116,272 |
| 2021 | $3,346 | $143,546 | $27,274 | $116,272 |
| 2020 | $3,591 | $143,546 | $27,274 | $116,272 |
| 2019 | $3,529 | $136,893 | $26,010 | $110,883 |
| 2018 | $3,110 | $122,905 | $23,352 | $99,553 |
| 2017 | $2,692 | $103,189 | $19,606 | $83,583 |
| 2016 | $2,462 | $103,189 | $19,606 | $83,583 |
| 2015 | $388 | $95,103 | $18,070 | $77,033 |
| 2014 | $388 | $78,000 | $14,820 | $63,180 |
Source: Public Records
Map
Nearby Homes
- 7256 Regency Square Ct Unit 7756
- 7318 Regency Square Ct Unit 7318
- 7399 Regency Square Ct Unit 7399
- 7387 Regency Square Ct Unit 7387
- 7143 Windwater Lagoon
- 7127 Windwater Lagoon
- 5931 Turtle Beach Ln
- 5915 Turtle Beach Ln
- 7146 Harmony Cove
- 7134 Harmony Cove
- 7150 Windwater Pkwy N
- 6131 Stoney Brook Dr
- 7107 Harmony Cove
- 6001 Reims Rd Unit 1207
- 6001 Reims Rd Unit 309
- 6001 Reims Rd Unit 408
- 6001 Reims Rd Unit 405
- 6001 Reims Rd Unit 706
- 6001 Reims Rd Unit 205
- 6001 Reims Rd Unit 708
- 7346 Regency Square Ct Unit 7346
- 7326 Regency Square Ct Unit 7326
- 7397 Regency Square Ct Unit 7397
- 7332 Regency Square Ct Unit 7332
- 7358 Regency Square Ct Unit 7358
- 7330 Regency Square Ct Unit 7330
- 7350 Regency Square Ct Unit 7350
- 7383 Regency Square Ct Unit 7383
- 7386 Regency Square Ct Unit 7386
- 7352 Regency Square Ct Unit 7352
- 7389 Regency Square Ct Unit 7389
- 7396 Regency Square Ct Unit 7396
- 7381 Regency Square Ct Unit 7381
- 7392 Regency Square Ct Unit 7392
- 7395 Regency Square Ct Unit 7395
- 7354 Regency Square Ct Unit 7354
- 7328 Regency Square Ct Unit 7328
- 7391 Regency Square Ct Unit 7391
- 7324 Regency Square Ct Unit 7324
- 7393 Regency Square Ct Unit 7393