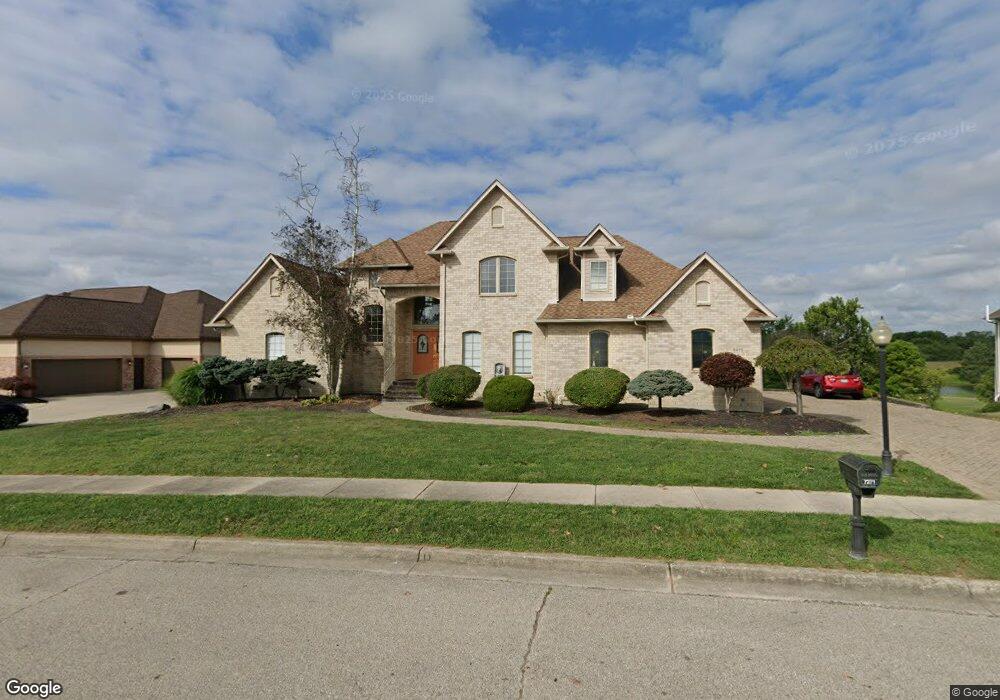
7271 Wentworth Way Clayton, OH 45315
Estimated Value: $341,000 - $536,000
4
Beds
4
Baths
2,468
Sq Ft
$191/Sq Ft
Est. Value
About This Home
This home is located at 7271 Wentworth Way, Clayton, OH 45315 and is currently estimated at $471,042, approximately $190 per square foot. 7271 Wentworth Way is a home located in Montgomery County with nearby schools including Northmoor Elementary School, Northmont High School, and Trotwood Preparatory & Fitness Academy.
Ownership History
Date
Name
Owned For
Owner Type
Purchase Details
Closed on
May 19, 2022
Sold by
Volland James L
Bought by
Campbell Anthony and Cain Regina
Current Estimated Value
Home Financials for this Owner
Home Financials are based on the most recent Mortgage that was taken out on this home.
Original Mortgage
$275,000
Outstanding Balance
$261,291
Interest Rate
5.27%
Mortgage Type
New Conventional
Estimated Equity
$209,751
Purchase Details
Closed on
Jan 30, 2020
Sold by
Julian Phillip G and Julian Velma S
Bought by
Voiland James L
Home Financials for this Owner
Home Financials are based on the most recent Mortgage that was taken out on this home.
Original Mortgage
$270,000
Interest Rate
3.74%
Mortgage Type
New Conventional
Purchase Details
Closed on
Aug 20, 1999
Sold by
Moss Creek Development Company Ltd
Bought by
Julian Phillip G and Julian Velma S
Home Financials for this Owner
Home Financials are based on the most recent Mortgage that was taken out on this home.
Original Mortgage
$332,000
Interest Rate
7%
Create a Home Valuation Report for This Property
The Home Valuation Report is an in-depth analysis detailing your home's value as well as a comparison with similar homes in the area
Home Values in the Area
Average Home Value in this Area
Purchase History
| Date | Buyer | Sale Price | Title Company |
|---|---|---|---|
| Campbell Anthony | -- | None Listed On Document | |
| Voiland James L | $360,000 | Sterling Land Title Agcy Inc | |
| Julian Phillip G | $80,900 | -- |
Source: Public Records
Mortgage History
| Date | Status | Borrower | Loan Amount |
|---|---|---|---|
| Open | Campbell Anthony | $275,000 | |
| Previous Owner | Voiland James L | $270,000 | |
| Previous Owner | Julian Phillip G | $332,000 |
Source: Public Records
Tax History Compared to Growth
Tax History
| Year | Tax Paid | Tax Assessment Tax Assessment Total Assessment is a certain percentage of the fair market value that is determined by local assessors to be the total taxable value of land and additions on the property. | Land | Improvement |
|---|---|---|---|---|
| 2024 | $8,364 | $130,410 | $15,800 | $114,610 |
| 2023 | $8,364 | $130,410 | $15,800 | $114,610 |
| 2022 | $8,729 | $101,090 | $12,250 | $88,840 |
| 2021 | $8,546 | $101,090 | $12,250 | $88,840 |
| 2020 | $7,797 | $101,090 | $12,250 | $88,840 |
| 2019 | $7,285 | $85,720 | $12,250 | $73,470 |
| 2018 | $8,934 | $102,510 | $12,250 | $90,260 |
| 2017 | $8,878 | $102,510 | $12,250 | $90,260 |
| 2016 | $8,371 | $95,820 | $12,250 | $83,570 |
| 2015 | $7,769 | $95,820 | $12,250 | $83,570 |
| 2014 | $7,769 | $95,820 | $12,250 | $83,570 |
| 2012 | -- | $89,810 | $15,750 | $74,060 |
Source: Public Records
Map
Nearby Homes
- . Wentworth Way
- 7132 Cierra Dr
- 5619 Moss Creek Blvd
- 0 Breckenridge Trail Unit 1040231
- Juniper Plan at Westbrook Meadows
- Cooper Plan at Westbrook Meadows
- Ashton Plan at Westbrook Meadows
- Palmetto Plan at Westbrook Meadows
- Aspen II Plan at Westbrook Meadows
- Norway Plan at Westbrook Meadows
- Empress Plan at Westbrook Meadows
- Bradford Plan at Westbrook Meadows
- Walnut Plan at Westbrook Meadows
- Ironwood Plan at Westbrook Meadows
- Chestnut Plan at Westbrook Meadows
- Spruce Plan at Westbrook Meadows
- 5125 Shiloh Springs Rd
- 6047 Summersweet Dr
- 8277 Westbrook Rd
- 1018 Redwood Rd
- 7261 Wentworth Way
- 7276 Wentworth Way
- 7281 Wentworth Way
- 7296 Wentworth Way
- 7246 Wentworth Way
- 7286 Wentworth Way
- 7226 Wentworth Way
- 5893 Wimbledon Point
- 0 Wimbledon Point Unit 618485
- 7216 Wentworth Way
- 5894 Wimbledon Point
- 7221 Wentworth Way
- 1 Moss Creek Blvd
- 1 Moss Creek Blvd
- 1 Moss Creek Blvd
- 7201 Wentworth Way
- 0 Wentworth Way Unit 416018
- 0 Wentworth Way Unit 488483
- 0 Wentworth Way Unit 488477
- 11 Wentworth Way