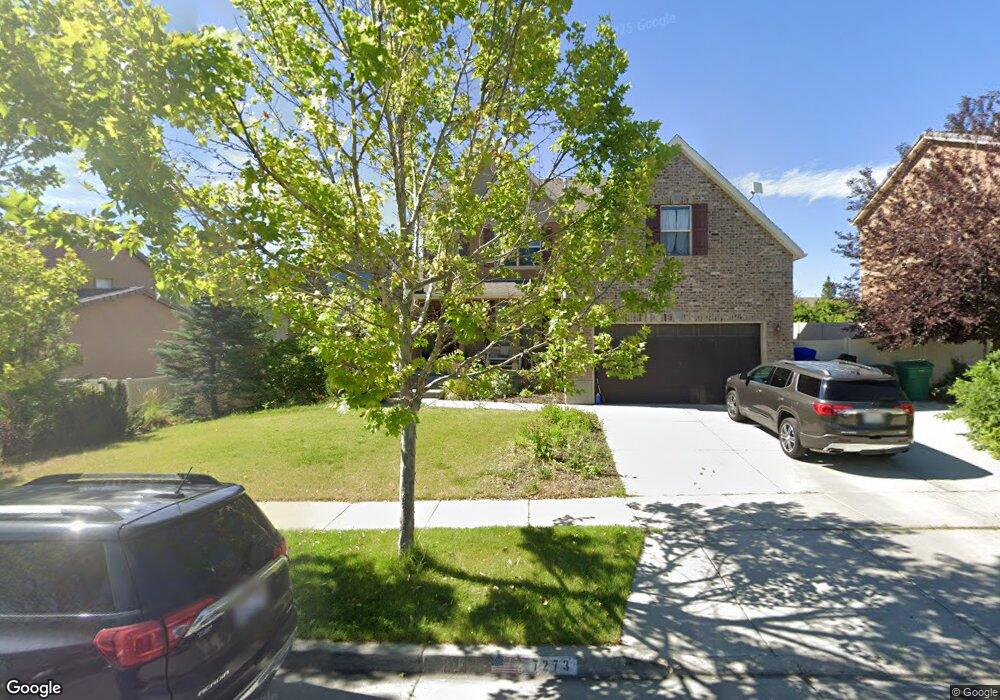
7273 W Ramford Way West Jordan, UT 84081
Jordan Hills NeighborhoodEstimated Value: $776,000 - $812,000
3
Beds
3
Baths
4,927
Sq Ft
$162/Sq Ft
Est. Value
About This Home
This home is located at 7273 W Ramford Way, West Jordan, UT 84081 and is currently estimated at $796,766, approximately $161 per square foot. 7273 W Ramford Way is a home located in Salt Lake County with nearby schools including Sunset Ridge Middle School, Copper Hills High School, and Ascent Academies of Utah West Jordan.
Ownership History
Date
Name
Owned For
Owner Type
Purchase Details
Closed on
Nov 18, 2016
Sold by
Saling Mitchell and Saling Elizabeth
Bought by
Saling Mitchell Wesley and Saling Elizabeth Ann
Current Estimated Value
Purchase Details
Closed on
Dec 28, 2012
Sold by
Saling Mitchell and Saling Elizabeth
Bought by
Saling Elizabeth and Saling Mitchell
Home Financials for this Owner
Home Financials are based on the most recent Mortgage that was taken out on this home.
Original Mortgage
$242,600
Outstanding Balance
$167,890
Interest Rate
3.27%
Mortgage Type
New Conventional
Estimated Equity
$628,876
Purchase Details
Closed on
Jun 10, 2010
Sold by
Richmond American Homes Of Utah Inc
Bought by
Saling Mitchell and Saling Elizabeth
Home Financials for this Owner
Home Financials are based on the most recent Mortgage that was taken out on this home.
Original Mortgage
$236,168
Interest Rate
5.03%
Mortgage Type
New Conventional
Create a Home Valuation Report for This Property
The Home Valuation Report is an in-depth analysis detailing your home's value as well as a comparison with similar homes in the area
Home Values in the Area
Average Home Value in this Area
Purchase History
| Date | Buyer | Sale Price | Title Company |
|---|---|---|---|
| Saling Mitchell Wesley | -- | None Available | |
| Saling Elizabeth | -- | United Title Services | |
| Saling Mitchell | -- | First American Title |
Source: Public Records
Mortgage History
| Date | Status | Borrower | Loan Amount |
|---|---|---|---|
| Open | Saling Elizabeth | $242,600 | |
| Closed | Saling Mitchell | $236,168 |
Source: Public Records
Tax History Compared to Growth
Tax History
| Year | Tax Paid | Tax Assessment Tax Assessment Total Assessment is a certain percentage of the fair market value that is determined by local assessors to be the total taxable value of land and additions on the property. | Land | Improvement |
|---|---|---|---|---|
| 2025 | $3,832 | $758,300 | $176,500 | $581,800 |
| 2024 | $3,832 | $737,200 | $171,400 | $565,800 |
| 2023 | $3,896 | $706,500 | $164,800 | $541,700 |
| 2022 | $4,051 | $722,700 | $161,600 | $561,100 |
| 2021 | $3,415 | $554,600 | $127,300 | $427,300 |
| 2020 | $3,201 | $487,800 | $127,300 | $360,500 |
| 2019 | $3,250 | $485,700 | $127,300 | $358,400 |
| 2018 | $2,854 | $423,100 | $125,200 | $297,900 |
| 2017 | $2,701 | $398,600 | $125,200 | $273,400 |
| 2016 | $2,690 | $373,000 | $122,200 | $250,800 |
| 2015 | $2,812 | $380,100 | $124,500 | $255,600 |
| 2014 | $2,553 | $339,800 | $112,900 | $226,900 |
Source: Public Records
Map
Nearby Homes
- 8169 S Flaxton Ln
- 7171 W 8170 S
- 7953 S 7110 W
- 7106 W 7800 S Unit 250
- 7182 Moorepark Place Unit 10
- 7169 Moorepark Place
- 7176 Moorepark Place
- 7069 W Cottage Point Dr
- 7853 Flattop Mount Dr Unit 356
- 7092 W Jayson Bend Dr
- 7011 W Saw Timber Way
- 7776 S Iron Core Ln
- 7009 W 7895 S
- Witzel Plan at The Sycamores
- Beatrix Plan at The Sycamores
- Sweetwater Plan at The Sycamores
- Princeton Plan at The Sycamores
- Dakota Plan at The Sycamores
- Dashell Plan at The Sycamores
- Roosevelt Plan at The Sycamores
- 7273 Ramford Way
- 7283 Ramford Way
- 7259 W Ramford Way
- 7259 Ramford Way
- 7272 W Heywood Dr
- 7272 W Heywood Dr Unit Lt 848
- 7276 Ramford Way
- 7282 W Heywood Dr
- 7276 W Ramford Way
- 7272 Heywood Dr
- 7258 W Heywood Dr
- 7247 W Ramford Way
- 7264 Ramford Way
- 7297 Ramford Way
- 7264 W Ramford Way
- 7247 W Ramford Way
- 7246 Heywood Dr
- 7292 Ramford Way
- 7282 Heywood Dr
- 7248 W Ramford Way