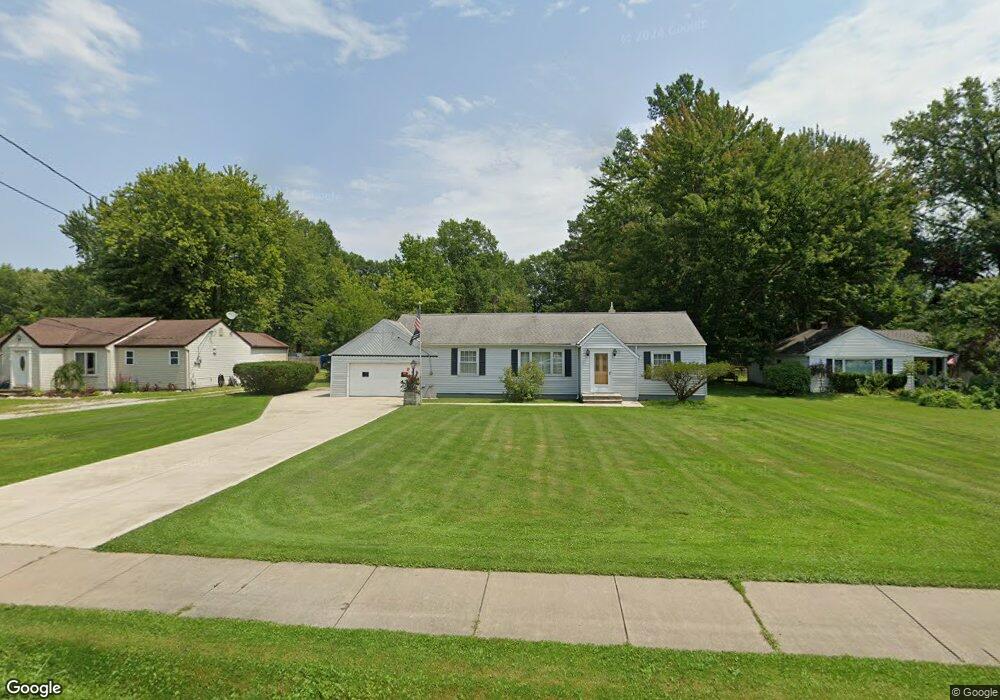
7277 Fitch Rd Olmsted Township, OH 44138
Estimated Value: $246,000 - $313,000
2
Beds
1
Bath
1,584
Sq Ft
$174/Sq Ft
Est. Value
About This Home
This home is located at 7277 Fitch Rd, Olmsted Township, OH 44138 and is currently estimated at $276,401, approximately $174 per square foot. 7277 Fitch Rd is a home located in Cuyahoga County with nearby schools including Falls-Lenox Primary Elementary School, Olmsted Falls Intermediate Building, and Olmsted Falls Middle School.
Ownership History
Date
Name
Owned For
Owner Type
Purchase Details
Closed on
Mar 22, 1985
Sold by
Bunyak Thomas E and Bunyak Irene
Bought by
Bunyak Thomas E
Current Estimated Value
Purchase Details
Closed on
Jan 1, 1975
Bought by
Bunyak Thomas E and Bunyak Irene
Create a Home Valuation Report for This Property
The Home Valuation Report is an in-depth analysis detailing your home's value as well as a comparison with similar homes in the area
Home Values in the Area
Average Home Value in this Area
Purchase History
| Date | Buyer | Sale Price | Title Company |
|---|---|---|---|
| Bunyak Thomas E | -- | -- | |
| Bunyak Thomas E | -- | -- |
Source: Public Records
Tax History Compared to Growth
Tax History
| Year | Tax Paid | Tax Assessment Tax Assessment Total Assessment is a certain percentage of the fair market value that is determined by local assessors to be the total taxable value of land and additions on the property. | Land | Improvement |
|---|---|---|---|---|
| 2024 | $5,380 | $83,580 | $15,470 | $68,110 |
| 2023 | $4,267 | $56,920 | $12,360 | $44,560 |
| 2022 | $4,315 | $56,910 | $12,360 | $44,560 |
| 2021 | $4,273 | $56,910 | $12,360 | $44,560 |
| 2020 | $3,922 | $47,850 | $10,400 | $37,450 |
| 2019 | $3,547 | $136,700 | $29,700 | $107,000 |
| 2018 | $3,263 | $47,850 | $10,400 | $37,450 |
| 2017 | $3,142 | $42,180 | $8,470 | $33,710 |
| 2016 | $3,126 | $42,180 | $8,470 | $33,710 |
| 2015 | $3,175 | $42,180 | $8,470 | $33,710 |
| 2014 | $3,175 | $42,180 | $8,470 | $33,710 |
Source: Public Records
Map
Nearby Homes
- 3 Fiddle Sticks
- 7224 Pine Woods Way
- 20 Van Ess Dr
- 11 Concert Ct
- 3 Concert Ln
- 16 Van Ess Dr
- 7296 Chestnut Ct
- 7087 Mackenzie Rd
- 11 Brookins Dr
- 55 Patio Ln
- VANDERBURGH Plan at Olmsted - Sanctuary of
- LYNDHURST Plan at Olmsted - Sanctuary of
- BELLEVILLE Plan at Olmsted - Sanctuary of
- ALDEN Plan at Olmsted - Sanctuary of
- VALE Plan at Olmsted - Sanctuary of
- BUCHANAN Plan at Olmsted - Sanctuary of
- 5 Hawthorn Dr
- 26915 Eastwood Ln
- 26946 Westwood Ln
- 6926 Mackenzie Rd
- 7295 Fitch Rd
- 7237 Fitch Rd
- 7317 Fitch Rd
- 7260 Fitch Rd
- 7280 Fitch Rd
- 7240 Fitch Rd
- 7339 Fitch Rd
- 7217 Fitch Rd
- 7220 Fitch Rd
- 7361 Fitch Rd
- 7200 Fitch Rd
- 7179 Fitch Rd
- 26903 Heatherwood Cir
- 26902 Heatherwood Cir
- 2 Matthews Creek
- 69 Periwinkle Dr
- 7180 Fitch Rd
- 65 Periwinkle Dr
- 4 Matthews Corner
- 26882 Cook Rd