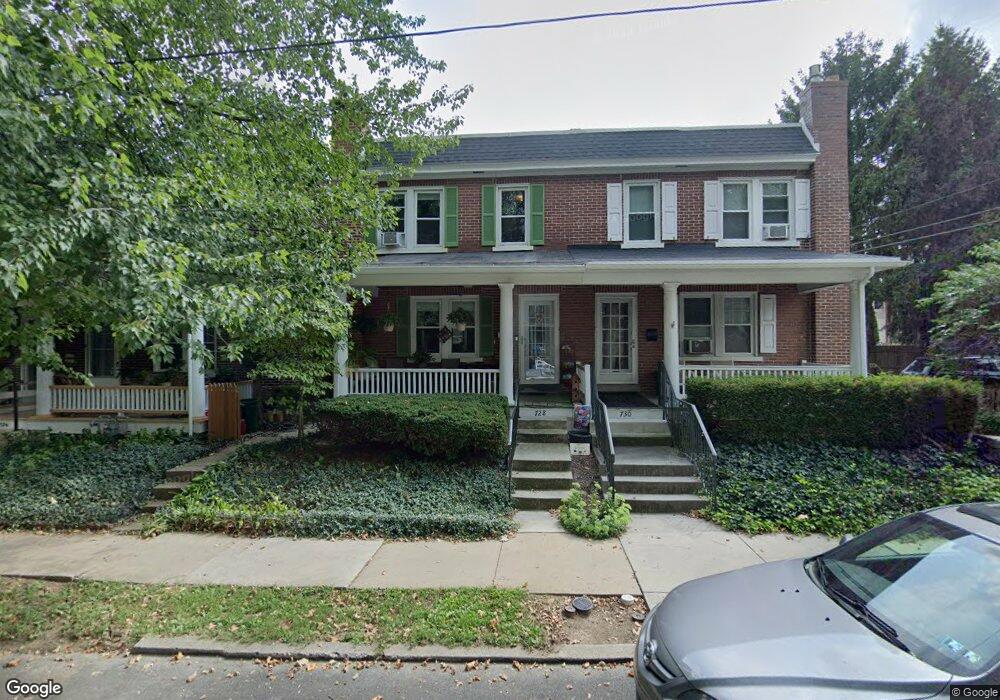
728 3rd St Lancaster, PA 17603
West End NeighborhoodEstimated Value: $212,000 - $252,000
3
Beds
1
Bath
1,240
Sq Ft
$187/Sq Ft
Est. Value
About This Home
This home is located at 728 3rd St, Lancaster, PA 17603 and is currently estimated at $231,481, approximately $186 per square foot. 728 3rd St is a home located in Lancaster County with nearby schools including Smith-Wade-El Elementary School, Wheatland Middle School, and McCaskey High School.
Ownership History
Date
Name
Owned For
Owner Type
Purchase Details
Closed on
Apr 27, 2001
Sold by
Parsons Yvonne M and Parsons Robert C
Bought by
Shoffstall Daniel J and Shoffstall Nancy S
Current Estimated Value
Home Financials for this Owner
Home Financials are based on the most recent Mortgage that was taken out on this home.
Original Mortgage
$64,452
Outstanding Balance
$23,799
Interest Rate
6.88%
Mortgage Type
FHA
Estimated Equity
$207,682
Create a Home Valuation Report for This Property
The Home Valuation Report is an in-depth analysis detailing your home's value as well as a comparison with similar homes in the area
Home Values in the Area
Average Home Value in this Area
Purchase History
| Date | Buyer | Sale Price | Title Company |
|---|---|---|---|
| Shoffstall Daniel J | $65,000 | Fidelity National Title Ins |
Source: Public Records
Mortgage History
| Date | Status | Borrower | Loan Amount |
|---|---|---|---|
| Open | Shoffstall Daniel J | $64,452 |
Source: Public Records
Tax History
| Year | Tax Paid | Tax Assessment Tax Assessment Total Assessment is a certain percentage of the fair market value that is determined by local assessors to be the total taxable value of land and additions on the property. | Land | Improvement |
|---|---|---|---|---|
| 2025 | $3,807 | $96,200 | $23,300 | $72,900 |
| 2024 | $3,807 | $96,200 | $23,300 | $72,900 |
| 2023 | $3,743 | $96,200 | $23,300 | $72,900 |
| 2022 | $3,587 | $96,200 | $23,300 | $72,900 |
| 2021 | $3,510 | $96,200 | $23,300 | $72,900 |
| 2020 | $3,510 | $96,200 | $23,300 | $72,900 |
| 2019 | $3,457 | $96,200 | $23,300 | $72,900 |
| 2018 | $1,615 | $96,200 | $23,300 | $72,900 |
| 2017 | $3,312 | $72,100 | $16,200 | $55,900 |
| 2016 | $3,281 | $72,100 | $16,200 | $55,900 |
| 2015 | $1,280 | $72,100 | $16,200 | $55,900 |
| 2014 | $2,437 | $72,100 | $16,200 | $55,900 |
Source: Public Records
Map
Nearby Homes
Your Personal Tour Guide
Ask me questions while you tour the home.