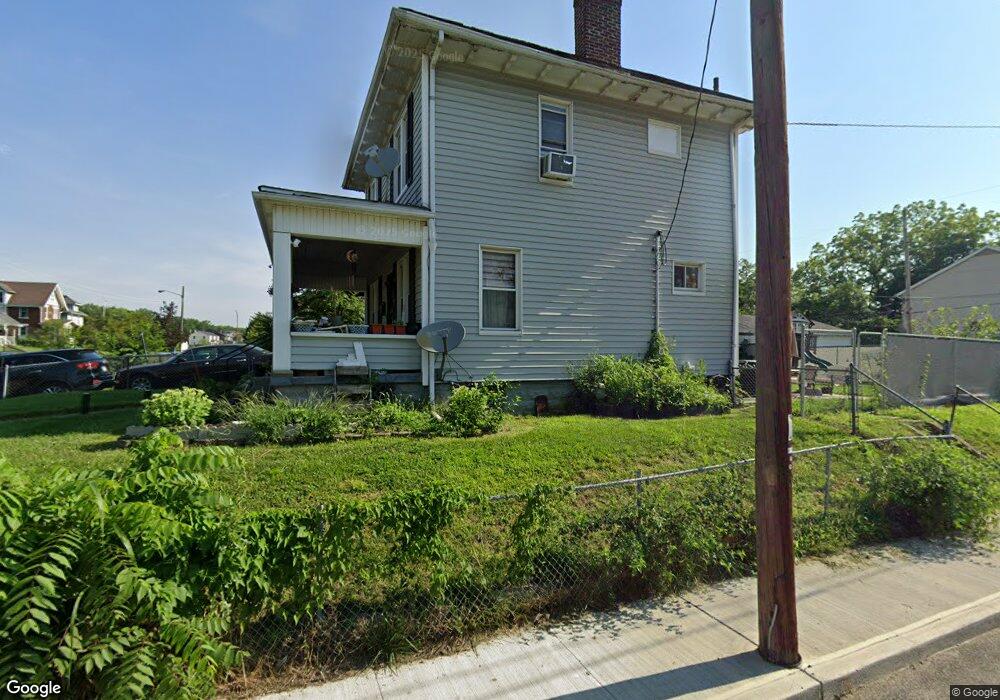
728 Berkeley Rd Columbus, OH 43205
Driving Park NeighborhoodEstimated Value: $161,000 - $198,000
3
Beds
1
Bath
1,332
Sq Ft
$133/Sq Ft
Est. Value
About This Home
This home is located at 728 Berkeley Rd, Columbus, OH 43205 and is currently estimated at $177,026, approximately $132 per square foot. 728 Berkeley Rd is a home located in Franklin County with nearby schools including Fairwood Alternative Elementary School, South High School, and Capital Collegiate Preparatory Academy.
Ownership History
Date
Name
Owned For
Owner Type
Purchase Details
Closed on
Jul 23, 2022
Sold by
Kendrick Jeffrey K and Kendrick Anjeanette M
Bought by
Kendrick Randall K
Current Estimated Value
Home Financials for this Owner
Home Financials are based on the most recent Mortgage that was taken out on this home.
Original Mortgage
$60,000
Outstanding Balance
$53,831
Interest Rate
5.81%
Mortgage Type
New Conventional
Estimated Equity
$123,195
Purchase Details
Closed on
Aug 19, 2007
Sold by
Johnson Teresa
Bought by
Kendrick Kay F
Purchase Details
Closed on
Jun 13, 2007
Sold by
Bruce Angela
Bought by
Kendrick Kay F
Purchase Details
Closed on
Mar 15, 2006
Sold by
Estate Of Anna M Johnson
Bought by
Johnson Teresa and Kendrick Kay F
Purchase Details
Closed on
Jul 14, 1988
Bought by
Johnson Anna M
Purchase Details
Closed on
Apr 12, 1988
Create a Home Valuation Report for This Property
The Home Valuation Report is an in-depth analysis detailing your home's value as well as a comparison with similar homes in the area
Home Values in the Area
Average Home Value in this Area
Purchase History
| Date | Buyer | Sale Price | Title Company |
|---|---|---|---|
| Kendrick Randall K | -- | Timios | |
| Kendrick Kay F | $16,900 | None Available | |
| Kendrick Kay F | $16,900 | None Available | |
| Johnson Teresa | -- | None Available | |
| Johnson Anna M | -- | -- | |
| -- | -- | -- |
Source: Public Records
Mortgage History
| Date | Status | Borrower | Loan Amount |
|---|---|---|---|
| Open | Kendrick Randall K | $60,000 |
Source: Public Records
Tax History
| Year | Tax Paid | Tax Assessment Tax Assessment Total Assessment is a certain percentage of the fair market value that is determined by local assessors to be the total taxable value of land and additions on the property. | Land | Improvement |
|---|---|---|---|---|
| 2025 | $2,737 | $56,460 | $10,360 | $46,100 |
| 2024 | $2,737 | $56,460 | $10,360 | $46,100 |
| 2023 | $2,803 | $56,455 | $10,360 | $46,095 |
| 2022 | $2,050 | $23,000 | $2,730 | $20,270 |
| 2021 | $1,745 | $23,000 | $2,730 | $20,270 |
| 2020 | $1,422 | $23,000 | $2,730 | $20,270 |
| 2019 | $1,374 | $18,410 | $2,170 | $16,240 |
| 2018 | $781 | $18,410 | $2,170 | $16,240 |
| 2017 | $1,110 | $18,410 | $2,170 | $16,240 |
| 2016 | $1,194 | $14,180 | $3,220 | $10,960 |
| 2015 | $298 | $14,180 | $3,220 | $10,960 |
| 2014 | $327 | $14,180 | $3,220 | $10,960 |
| 2013 | $235 | $16,660 | $3,780 | $12,880 |
Source: Public Records
Map
Nearby Homes
- 768 Berkeley Rd
- 778 Berkeley Rd
- 782 Berkeley Rd
- 688 Berkeley Rd
- 711 Seymour Ave
- 702 Seymour Ave
- 831 Lilley Ave Unit 833
- 0 Lilley Ave
- 623 Seymour Ave
- 604 Berkeley Rd
- 899 Geers Ave
- 730 Miller Ave
- 731 Bulen Ave
- 1614 E Fulton St
- 1390 E Livingston Ave
- 400 Miller Ave
- 697 Miller Ave
- 683 Miller Ave Unit 685
- 889 Kelton Ave
- 547 Berkeley Rd
- 724 Berkeley Rd
- 718 Berkeley Rd
- 740 Berkeley Rd
- 712 Berkeley Rd
- 1580 Kent St
- 1584 Kent St
- 706 Berkeley Rd
- 1575 Kent St
- 748 Berkeley Rd
- 1579 Kent St
- 1585 Kent St
- 702 Berkeley Rd Unit 704
- 704 Berkeley Rd
- 702 Berkeley Rd Unit 4
- 725 Berkeley Rd
- 721 Berkeley Rd
- 752 Berkeley Rd
- 717 Berkeley Rd
- 1588 Kent St
- 735 Berkeley Rd
Your Personal Tour Guide
Ask me questions while you tour the home.