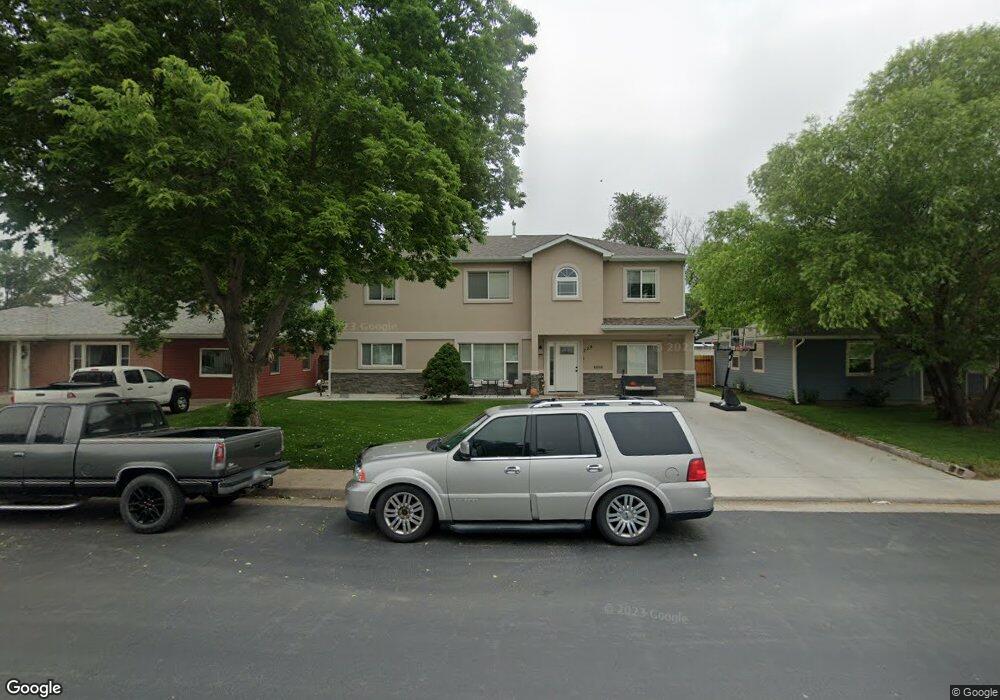
728 Carol St Fort Morgan, CO 80701
Estimated Value: $342,000 - $394,152
2
Beds
2
Baths
1,344
Sq Ft
$272/Sq Ft
Est. Value
About This Home
This home is located at 728 Carol St, Fort Morgan, CO 80701 and is currently estimated at $366,038, approximately $272 per square foot. 728 Carol St is a home located in Morgan County with nearby schools including Fort Morgan High School, Trinity Lutheran School, and Lighthouse Seventh-day Adventist Christian School.
Ownership History
Date
Name
Owned For
Owner Type
Purchase Details
Closed on
Jun 20, 2005
Sold by
Dones Larry A and Johnson Myrna L
Bought by
Mosqueda Jose Hugo and Mosqueda Blanca Helen
Current Estimated Value
Home Financials for this Owner
Home Financials are based on the most recent Mortgage that was taken out on this home.
Original Mortgage
$90,250
Outstanding Balance
$47,116
Interest Rate
5.76%
Mortgage Type
New Conventional
Estimated Equity
$318,922
Create a Home Valuation Report for This Property
The Home Valuation Report is an in-depth analysis detailing your home's value as well as a comparison with similar homes in the area
Home Values in the Area
Average Home Value in this Area
Purchase History
| Date | Buyer | Sale Price | Title Company |
|---|---|---|---|
| Mosqueda Jose Hugo | $95,000 | None Available |
Source: Public Records
Mortgage History
| Date | Status | Borrower | Loan Amount |
|---|---|---|---|
| Open | Mosqueda Jose Hugo | $90,250 |
Source: Public Records
Tax History Compared to Growth
Tax History
| Year | Tax Paid | Tax Assessment Tax Assessment Total Assessment is a certain percentage of the fair market value that is determined by local assessors to be the total taxable value of land and additions on the property. | Land | Improvement |
|---|---|---|---|---|
| 2024 | $2,251 | $28,110 | $2,110 | $26,000 |
| 2023 | $2,251 | $31,800 | $2,390 | $29,410 |
| 2022 | $1,819 | $22,190 | $2,340 | $19,850 |
| 2021 | $1,872 | $22,820 | $2,400 | $20,420 |
| 2020 | $1,754 | $20,800 | $2,290 | $18,510 |
| 2019 | $1,029 | $12,180 | $2,290 | $9,890 |
| 2018 | $747 | $8,720 | $1,900 | $6,820 |
| 2017 | $748 | $8,720 | $1,900 | $6,820 |
| 2016 | $723 | $8,350 | $2,290 | $6,060 |
| 2015 | $713 | $8,350 | $2,290 | $6,060 |
| 2014 | $648 | $7,410 | $2,040 | $5,370 |
| 2013 | -- | $7,410 | $2,040 | $5,370 |
Source: Public Records
Map
Nearby Homes