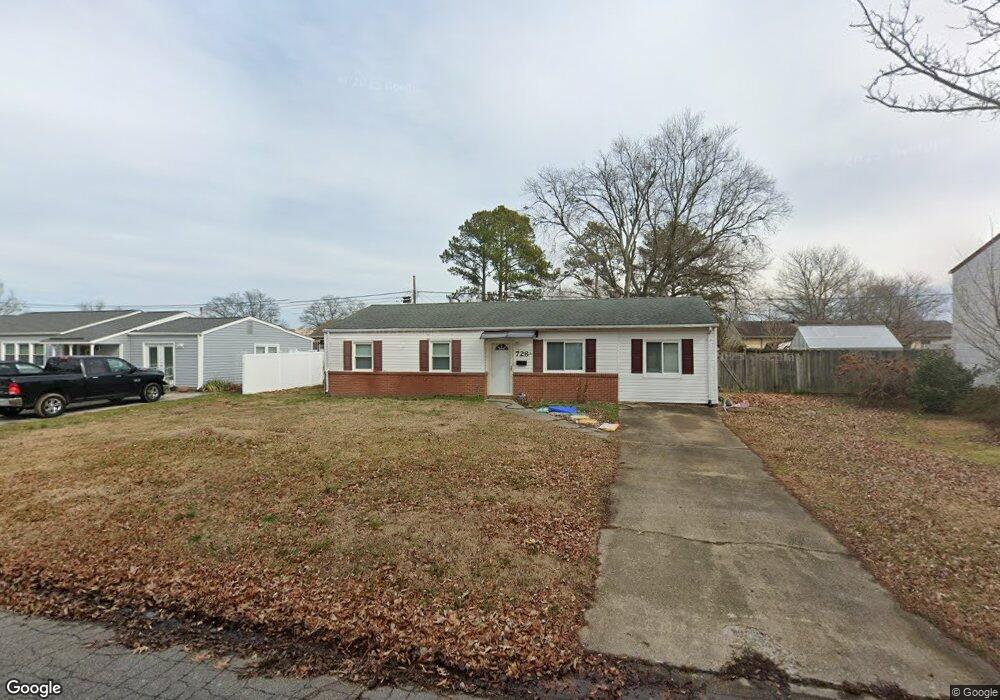
728 Carriage Hill Rd Virginia Beach, VA 23452
Bow Creek NeighborhoodEstimated Value: $220,000 - $317,000
3
Beds
1
Bath
1,072
Sq Ft
$258/Sq Ft
Est. Value
About This Home
This home is located at 728 Carriage Hill Rd, Virginia Beach, VA 23452 and is currently estimated at $276,730, approximately $258 per square foot. 728 Carriage Hill Rd is a home located in Virginia Beach City with nearby schools including Brookwood Elementary School, Corporate Landing Middle School, and Ocean Lakes High School.
Ownership History
Date
Name
Owned For
Owner Type
Purchase Details
Closed on
Oct 27, 2017
Sold by
Kent Joel R
Bought by
Lam Thuthuy T and Tu Phu Q
Current Estimated Value
Purchase Details
Closed on
Sep 15, 2004
Sold by
Johnson Burke
Bought by
Kent Joel R
Home Financials for this Owner
Home Financials are based on the most recent Mortgage that was taken out on this home.
Original Mortgage
$112,000
Interest Rate
5.84%
Mortgage Type
New Conventional
Purchase Details
Closed on
Nov 30, 2001
Sold by
Despinis Iracles C
Bought by
Johnson Burke
Home Financials for this Owner
Home Financials are based on the most recent Mortgage that was taken out on this home.
Original Mortgage
$98,400
Interest Rate
6.66%
Purchase Details
Closed on
Mar 15, 2000
Sold by
Fujimoto Steve E
Bought by
Despinis Iracles
Home Financials for this Owner
Home Financials are based on the most recent Mortgage that was taken out on this home.
Original Mortgage
$87,700
Interest Rate
8.24%
Create a Home Valuation Report for This Property
The Home Valuation Report is an in-depth analysis detailing your home's value as well as a comparison with similar homes in the area
Home Values in the Area
Average Home Value in this Area
Purchase History
| Date | Buyer | Sale Price | Title Company |
|---|---|---|---|
| Lam Thuthuy T | $130,000 | Attorney | |
| Jent Joel R | -- | None Available | |
| Kent Joel R | $140,000 | -- | |
| Johnson Burke | $96,500 | -- | |
| Despinis Iracles | $86,000 | -- |
Source: Public Records
Mortgage History
| Date | Status | Borrower | Loan Amount |
|---|---|---|---|
| Previous Owner | Kent Joel R | $112,000 | |
| Previous Owner | Johnson Burke | $98,400 | |
| Previous Owner | Despinis Iracles | $87,700 |
Source: Public Records
Tax History Compared to Growth
Tax History
| Year | Tax Paid | Tax Assessment Tax Assessment Total Assessment is a certain percentage of the fair market value that is determined by local assessors to be the total taxable value of land and additions on the property. | Land | Improvement |
|---|---|---|---|---|
| 2025 | $2,193 | $228,600 | $129,000 | $99,600 |
| 2024 | $2,193 | $226,100 | $115,000 | $111,100 |
| 2023 | $2,159 | $218,100 | $111,000 | $107,100 |
| 2022 | $2,036 | $205,700 | $111,000 | $94,700 |
| 2021 | $1,706 | $172,300 | $88,000 | $84,300 |
| 2020 | $1,665 | $163,600 | $80,000 | $83,600 |
| 2019 | $1,653 | $156,000 | $80,000 | $76,000 |
| 2018 | $1,564 | $156,000 | $80,000 | $76,000 |
| 2017 | $1,489 | $148,500 | $72,500 | $76,000 |
| 2016 | $1,470 | $148,500 | $72,500 | $76,000 |
| 2015 | $1,506 | $152,100 | $78,800 | $73,300 |
| 2014 | $1,434 | $145,500 | $84,000 | $61,500 |
Source: Public Records
Map
Nearby Homes
- 701 S Lynnhaven Rd
- 725 Burgesses Ln
- 705 Coach House Ct
- 3117 Coach House Ln
- 3016 Cobblestone Dr
- 3073 Pewter Rd
- 733 Lamplight Ln
- 2955 Talon Ct
- 816 Holly Hedge Ave
- 3217 Deer Park Dr
- 3063 Breslaw Ct
- 996 Lynnhaven Pkwy
- 3256 Deer Park Dr
- 3213 Burnt Mill Rd
- 907 S Club House Rd
- 3152 Ashaway Rd
- 720 Fox Run Rd
- 301 Bethune Dr
- 947 Fern Ridge Rd
- 3284 Skipper Dr
- 724 Carriage Hill Rd
- 732 Carriage Hill Rd
- 733 S Lynnhaven Rd
- 725 S Lynnhaven Rd
- 3008 Coach House Ln
- 720 Carriage Hill Rd
- 736 Carriage Hill Rd
- 737 S Lynnhaven Rd
- 3009 Coach House Ln
- 721 S Lynnhaven Rd
- 3009 Gentry Rd
- 3012 Coach House Ln
- 716 Carriage Hill Rd
- 740 Carriage Hill Rd
- 741 S Lynnhaven Rd
- 3013 Coach House Ln
- 717 S Lynnhaven Rd
- 3013 Gentry Rd
- 3008 Ashlawn Terrace
- 3016 Coach House Ln