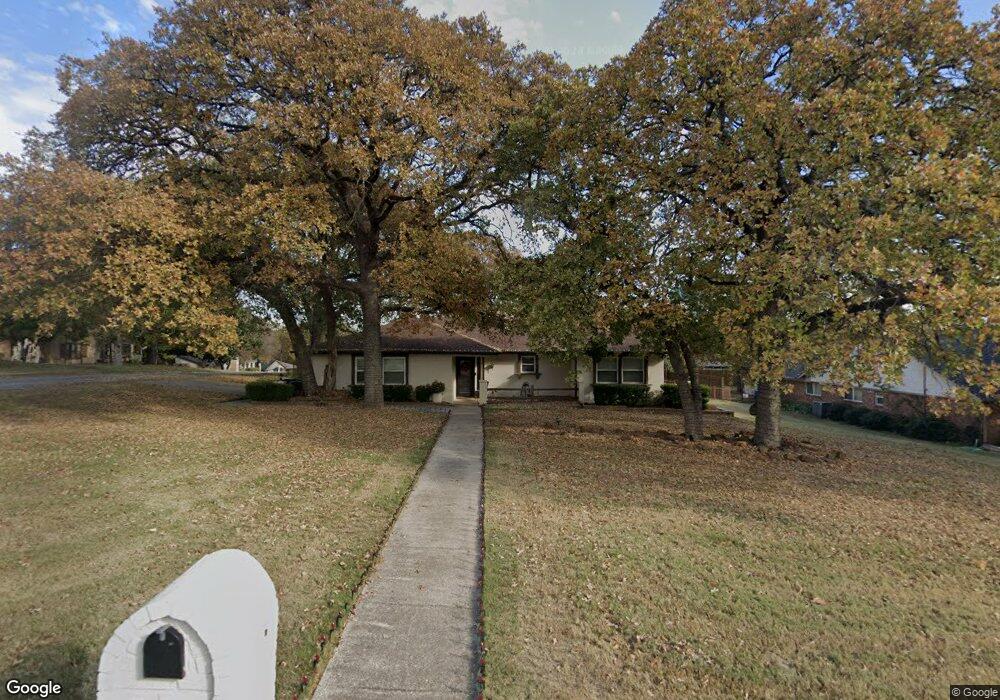
728 Cimarron Trail Southlake, TX 76092
Estimated Value: $559,000 - $656,000
3
Beds
2
Baths
2,068
Sq Ft
$294/Sq Ft
Est. Value
About This Home
This home is located at 728 Cimarron Trail, Southlake, TX 76092 and is currently estimated at $607,807, approximately $293 per square foot. 728 Cimarron Trail is a home located in Tarrant County with nearby schools including Florence Elementary School, Bear Creek Intermediate School, and Keller Middle School.
Ownership History
Date
Name
Owned For
Owner Type
Purchase Details
Closed on
May 15, 2020
Sold by
Ortman Pamela S and Osborn Pamela Sue
Bought by
Davis William Tyer
Current Estimated Value
Home Financials for this Owner
Home Financials are based on the most recent Mortgage that was taken out on this home.
Original Mortgage
$284,800
Outstanding Balance
$252,372
Interest Rate
3.3%
Mortgage Type
New Conventional
Estimated Equity
$355,435
Purchase Details
Closed on
Jan 30, 2014
Sold by
Cyrocki Steven A and Clarke Mary H
Bought by
Costino Phyllis T and Roeltgen Jennifer
Purchase Details
Closed on
Jul 12, 2013
Sold by
Stepp Carol
Bought by
Ortman Pamela S
Home Financials for this Owner
Home Financials are based on the most recent Mortgage that was taken out on this home.
Original Mortgage
$204,232
Interest Rate
4.25%
Mortgage Type
FHA
Create a Home Valuation Report for This Property
The Home Valuation Report is an in-depth analysis detailing your home's value as well as a comparison with similar homes in the area
Home Values in the Area
Average Home Value in this Area
Purchase History
| Date | Buyer | Sale Price | Title Company |
|---|---|---|---|
| Davis William Tyer | -- | Independence Title | |
| Costino Phyllis T | -- | Natco | |
| Ortman Pamela S | -- | None Available |
Source: Public Records
Mortgage History
| Date | Status | Borrower | Loan Amount |
|---|---|---|---|
| Open | Davis William Tyer | $284,800 | |
| Previous Owner | Ortman Pamela S | $204,232 |
Source: Public Records
Tax History Compared to Growth
Tax History
| Year | Tax Paid | Tax Assessment Tax Assessment Total Assessment is a certain percentage of the fair market value that is determined by local assessors to be the total taxable value of land and additions on the property. | Land | Improvement |
|---|---|---|---|---|
| 2025 | $6,404 | $464,450 | $177,760 | $286,690 |
| 2024 | $6,404 | -- | -- | -- |
| 2023 | $10,261 | $537,865 | $140,000 | $397,865 |
| 2022 | $7,884 | $356,491 | $70,000 | $286,491 |
| 2021 | $8,572 | $358,934 | $70,000 | $288,934 |
| 2020 | $7,743 | $321,717 | $70,000 | $251,717 |
| 2019 | $7,864 | $323,823 | $70,000 | $253,823 |
| 2018 | $6,521 | $280,176 | $70,000 | $210,176 |
| 2017 | $6,644 | $317,284 | $70,000 | $247,284 |
| 2016 | $6,040 | $291,386 | $70,000 | $221,386 |
| 2015 | $5,114 | $210,500 | $40,000 | $170,500 |
| 2014 | $5,114 | $210,500 | $40,000 | $170,500 |
Source: Public Records
Map
Nearby Homes
- 2912 Sutton Place
- 700 Overland Trail
- 2021 Vista Rd
- 2004 Vista View Rd
- 605 Royal Ln
- 600 Overland Trail
- 1925 Florence Rd
- 3095 Johnson Rd
- 605 Castleman Ct
- 404 Branding Iron Ct
- 1524 Windsor Forest Trail
- 146 Jellico Cir
- 1532 Windsor Forest Trail
- 2655 Johnson Rd
- 16 Marvin St
- 3210 Gray Ln
- 2405 Fernwood Dr
- 1006 Spanish Trail
- 2415 Poplar Ct
- Maverick Plan at Winding Creek
- 724 Cimarron Trail
- 729 Overland Trail
- 2108 Cumberland Trail
- 2112 Cumberland Trail
- 725 Overland Trail
- 729 Cimarron Trail
- 720 Cimarron Trail
- 725 Cimarron Trail
- 2100 Cumberland Trail
- 2116 Cumberland Trail
- 721 Overland Trail
- 721 Cimarron Trail
- 716 Cimarron Trail
- 717 Overland Trail
- 3125 Florence Rd
- 717 Cimarron Trail
- 728 Overland Trail
- 2120 Cumberland Trail
- 724 Overland Trail
- 712 Cimarron Trail