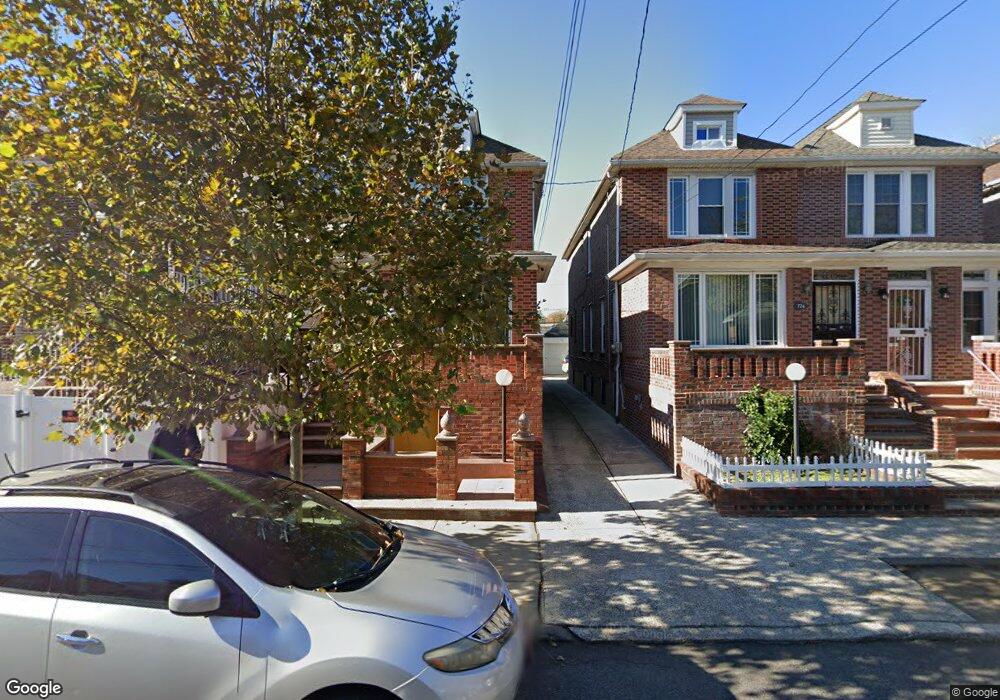
728 E 51st St Brooklyn, NY 11203
East Flatbush NeighborhoodEstimated Value: $677,328 - $813,000
Studio
--
Bath
1,452
Sq Ft
$503/Sq Ft
Est. Value
About This Home
This home is located at 728 E 51st St, Brooklyn, NY 11203 and is currently estimated at $730,332, approximately $502 per square foot. 728 E 51st St is a home located in Kings County with nearby schools including P.S. 208 Elsa Ebeling, I.S. 285 Meyer Levin, and Ivy Hill Preparatory Charter School.
Ownership History
Date
Name
Owned For
Owner Type
Purchase Details
Closed on
Feb 18, 2005
Sold by
Buckmire Leroy and Thomas Haydn
Bought by
Thomas Denyse and Thomas Haydn
Current Estimated Value
Purchase Details
Closed on
Sep 25, 2001
Sold by
Lawrence Maureen
Bought by
Thomas Haydn and Buckmire Leroy
Home Financials for this Owner
Home Financials are based on the most recent Mortgage that was taken out on this home.
Original Mortgage
$261,250
Outstanding Balance
$99,771
Interest Rate
6.86%
Estimated Equity
$630,561
Purchase Details
Closed on
Mar 3, 1999
Sold by
Garcia Danny
Bought by
Lawrence Maureen and Garcia Maureen
Home Financials for this Owner
Home Financials are based on the most recent Mortgage that was taken out on this home.
Original Mortgage
$170,757
Interest Rate
6.99%
Mortgage Type
FHA
Create a Home Valuation Report for This Property
The Home Valuation Report is an in-depth analysis detailing your home's value as well as a comparison with similar homes in the area
Home Values in the Area
Average Home Value in this Area
Purchase History
| Date | Buyer | Sale Price | Title Company |
|---|---|---|---|
| Thomas Denyse | -- | -- | |
| Thomas Denyse | -- | -- | |
| Thomas Haydn | -- | -- | |
| Thomas Haydn | -- | -- | |
| Lawrence Maureen | -- | Fidelity National Title Ins | |
| Lawrence Maureen | -- | Fidelity National Title Ins |
Source: Public Records
Mortgage History
| Date | Status | Borrower | Loan Amount |
|---|---|---|---|
| Open | Thomas Haydn | $261,250 | |
| Closed | Thomas Haydn | $261,250 | |
| Previous Owner | Lawrence Maureen | $170,757 |
Source: Public Records
Tax History
| Year | Tax Paid | Tax Assessment Tax Assessment Total Assessment is a certain percentage of the fair market value that is determined by local assessors to be the total taxable value of land and additions on the property. | Land | Improvement |
|---|---|---|---|---|
| 2025 | $6,872 | $44,220 | $15,300 | $28,920 |
| 2024 | $6,872 | $38,760 | $15,300 | $23,460 |
| 2023 | $6,556 | $46,200 | $15,300 | $30,900 |
| 2022 | $6,080 | $50,640 | $15,300 | $35,340 |
| 2021 | $6,409 | $40,020 | $15,300 | $24,720 |
| 2020 | $3,162 | $35,220 | $15,300 | $19,920 |
| 2019 | $5,965 | $31,680 | $15,300 | $16,380 |
| 2018 | $5,484 | $26,900 | $14,720 | $12,180 |
| 2017 | $5,174 | $25,380 | $12,470 | $12,910 |
| 2016 | $5,074 | $25,380 | $13,741 | $11,639 |
| 2015 | $2,888 | $25,186 | $14,818 | $10,368 |
| 2014 | $2,888 | $23,761 | $16,203 | $7,558 |
Source: Public Records
Map
Nearby Homes
Your Personal Tour Guide
Ask me questions while you tour the home.