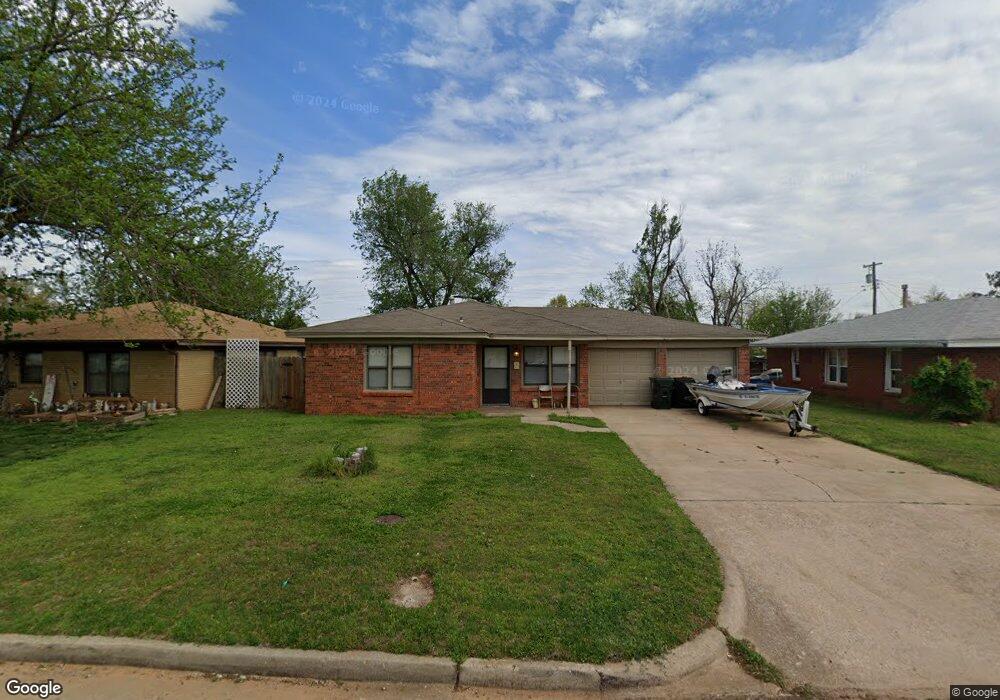
728 E Frolich Dr Oklahoma City, OK 73110
Estimated Value: $142,000 - $153,000
3
Beds
2
Baths
1,047
Sq Ft
$141/Sq Ft
Est. Value
About This Home
This home is located at 728 E Frolich Dr, Oklahoma City, OK 73110 and is currently estimated at $147,186, approximately $140 per square foot. 728 E Frolich Dr is a home located in Oklahoma County with nearby schools including Midwest City Middle School, Midwest City High School, and Insight School of Oklahoma High School.
Ownership History
Date
Name
Owned For
Owner Type
Purchase Details
Closed on
Apr 13, 2009
Sold by
Smith Kristina D
Bought by
Nees Frank J and Nees Janis M
Current Estimated Value
Home Financials for this Owner
Home Financials are based on the most recent Mortgage that was taken out on this home.
Original Mortgage
$57,500
Interest Rate
5.14%
Mortgage Type
Purchase Money Mortgage
Purchase Details
Closed on
Jun 26, 2003
Sold by
Homes Of Okc Inc
Bought by
Smith Kristina D
Purchase Details
Closed on
Jan 24, 2003
Sold by
Mitchell Stacey Allen
Bought by
Homes Of Okc Inc
Home Financials for this Owner
Home Financials are based on the most recent Mortgage that was taken out on this home.
Original Mortgage
$33,000
Interest Rate
6%
Purchase Details
Closed on
Dec 14, 2001
Sold by
Varner Mentha and Baldwin Thomas K
Bought by
Mitchell Stacey Allen
Create a Home Valuation Report for This Property
The Home Valuation Report is an in-depth analysis detailing your home's value as well as a comparison with similar homes in the area
Home Values in the Area
Average Home Value in this Area
Purchase History
| Date | Buyer | Sale Price | Title Company |
|---|---|---|---|
| Nees Frank J | $57,500 | Stewart Abstract & Title | |
| Smith Kristina D | $65,000 | Stewart Escrow & Title Mwc I | |
| Homes Of Okc Inc | $32,500 | -- | |
| Mitchell Stacey Allen | -- | -- |
Source: Public Records
Mortgage History
| Date | Status | Borrower | Loan Amount |
|---|---|---|---|
| Closed | Nees Frank J | $57,500 | |
| Previous Owner | Homes Of Okc Inc | $33,000 |
Source: Public Records
Tax History Compared to Growth
Tax History
| Year | Tax Paid | Tax Assessment Tax Assessment Total Assessment is a certain percentage of the fair market value that is determined by local assessors to be the total taxable value of land and additions on the property. | Land | Improvement |
|---|---|---|---|---|
| 2024 | $1,409 | $12,567 | $1,827 | $10,740 |
| 2023 | $1,409 | $11,968 | $1,576 | $10,392 |
| 2022 | $1,330 | $11,399 | $1,641 | $9,758 |
| 2021 | $1,297 | $10,857 | $1,822 | $9,035 |
| 2020 | $1,269 | $10,340 | $1,947 | $8,393 |
| 2019 | $1,255 | $10,683 | $1,597 | $9,086 |
| 2018 | $1,121 | $10,175 | $0 | $0 |
| 2017 | $1,127 | $10,064 | $1,620 | $8,444 |
| 2016 | $1,139 | $9,899 | $1,620 | $8,279 |
| 2015 | $1,165 | $9,727 | $1,725 | $8,002 |
| 2014 | $1,117 | $9,336 | $1,725 | $7,611 |
Source: Public Records
Map
Nearby Homes
- 2409 N Towry Dr
- 705 E Bouse Dr
- 620 E Bouse Dr
- 2104 Clary Dr
- 809 General Senter Dr
- 717 S Midwest Blvd
- 509 E Kerr Dr
- 2121 Stevens Dr
- 737 E Steed Dr
- 1125 Tall Oaks Dr
- 733 E Steed Dr
- 2109 Stevens Dr
- 2903 Del Casa Cir
- 225 Randall Dr
- 3200 N Holman Ct
- 617 Holman Place
- 409 N Midwest Blvd
- 216 Gill Dr
- 509 E Rose Dr
- 204 E Coe Dr
- 732 E Frolich Dr
- 724 E Frolich Dr
- 2333 N Towry Dr
- 736 E Frolich Dr
- 720 E Frolich Dr
- 2337 N Towry Dr
- 2329 N Towry Dr
- 2341 N Towry Dr
- 2325 N Towry Dr
- 725 E Frolich Dr
- 729 E Frolich Dr
- 716 E Frolich Dr
- 721 E Frolich Dr
- 733 E Frolich Dr
- 2321 N Towry Dr
- 717 E Frolich Dr
- 735 E Frolich Dr
- 712 E Frolich Dr
- 2401 N Towry Dr
- 801 E Frolich Dr