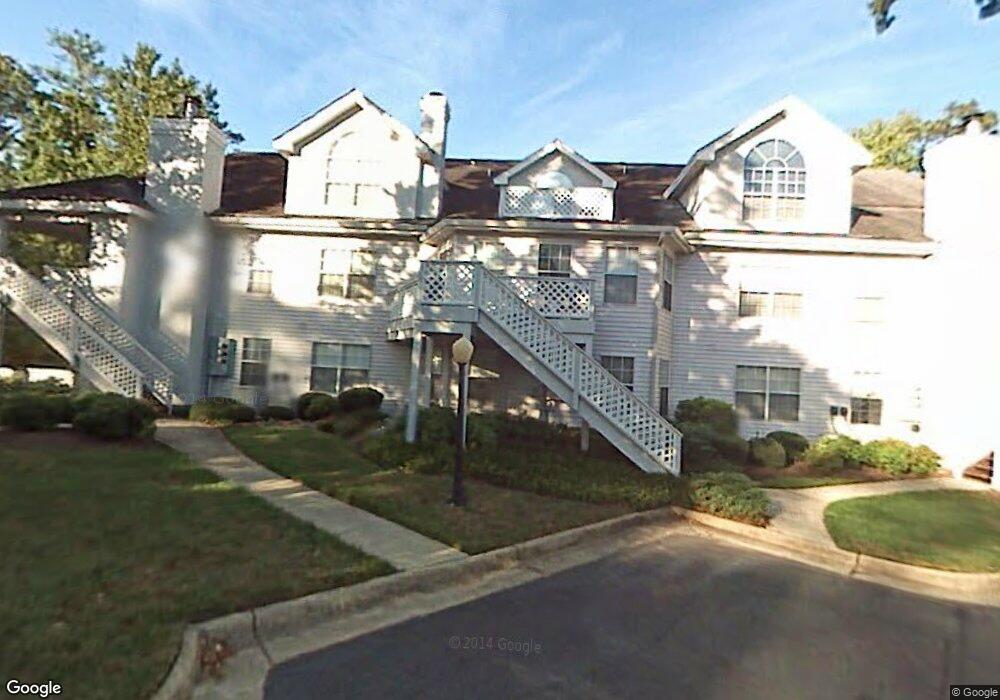
728 Inlet Quay Unit B Chesapeake, VA 23320
Greenbrier West NeighborhoodEstimated Value: $240,000 - $252,000
2
Beds
2
Baths
1,304
Sq Ft
$189/Sq Ft
Est. Value
About This Home
This home is located at 728 Inlet Quay Unit B, Chesapeake, VA 23320 and is currently estimated at $245,978, approximately $188 per square foot. 728 Inlet Quay Unit B is a home located in Chesapeake City with nearby schools including B.M. Williams Primary School, Crestwood Intermediate School, and Crestwood Middle School.
Ownership History
Date
Name
Owned For
Owner Type
Purchase Details
Closed on
Oct 4, 2021
Sold by
Fleming Roddy L and Fleming Patsy S
Bought by
Pascale Frank A and Pascale Donna L
Current Estimated Value
Home Financials for this Owner
Home Financials are based on the most recent Mortgage that was taken out on this home.
Original Mortgage
$207,669
Outstanding Balance
$189,375
Interest Rate
2.8%
Mortgage Type
VA
Estimated Equity
$56,603
Purchase Details
Closed on
Apr 29, 2019
Sold by
Raynor Melissa D
Bought by
Fleming Roddy I and Fleming Patsy S
Home Financials for this Owner
Home Financials are based on the most recent Mortgage that was taken out on this home.
Original Mortgage
$148,480
Interest Rate
4%
Mortgage Type
VA
Purchase Details
Closed on
Mar 7, 2016
Sold by
Springer Loretta M
Bought by
Raynor Melissa D
Home Financials for this Owner
Home Financials are based on the most recent Mortgage that was taken out on this home.
Original Mortgage
$120,650
Interest Rate
3.62%
Mortgage Type
New Conventional
Create a Home Valuation Report for This Property
The Home Valuation Report is an in-depth analysis detailing your home's value as well as a comparison with similar homes in the area
Home Values in the Area
Average Home Value in this Area
Purchase History
| Date | Buyer | Sale Price | Title Company |
|---|---|---|---|
| Pascale Frank A | $210,500 | Chancellor Title Agency Inc | |
| Fleming Roddy I | $145,000 | Vintage Est Title & Escrow | |
| Raynor Melissa D | $127,000 | Attorney |
Source: Public Records
Mortgage History
| Date | Status | Borrower | Loan Amount |
|---|---|---|---|
| Open | Pascale Frank A | $207,669 | |
| Previous Owner | Fleming Roddy I | $148,480 | |
| Previous Owner | Raynor Melissa D | $120,650 |
Source: Public Records
Tax History Compared to Growth
Tax History
| Year | Tax Paid | Tax Assessment Tax Assessment Total Assessment is a certain percentage of the fair market value that is determined by local assessors to be the total taxable value of land and additions on the property. | Land | Improvement |
|---|---|---|---|---|
| 2025 | $2,138 | $215,200 | $80,000 | $135,200 |
| 2024 | $2,138 | $211,700 | $80,000 | $131,700 |
| 2023 | $1,833 | $212,500 | $70,000 | $142,500 |
| 2022 | $1,785 | $176,700 | $60,000 | $116,700 |
| 2021 | $1,615 | $153,800 | $45,000 | $108,800 |
| 2020 | $1,545 | $147,100 | $40,000 | $107,100 |
| 2019 | $1,545 | $147,100 | $40,000 | $107,100 |
| 2018 | $1,544 | $148,500 | $40,000 | $108,500 |
| 2017 | $1,442 | $137,300 | $40,000 | $97,300 |
| 2016 | $1,341 | $127,700 | $35,000 | $92,700 |
| 2015 | $1,341 | $127,700 | $35,000 | $92,700 |
| 2014 | $1,472 | $140,200 | $35,000 | $105,200 |
Source: Public Records
Map
Nearby Homes
- 118 Esplanade Place
- 423 Seahorse Run
- 559 Seahorse Run
- 603 Sail Fish Quay
- 605 Sail Fish Quay
- 707 Sailfish Quay
- 732 Seagrass Reach
- 424 Supplejack Ct
- 705 New River Ct Unit A
- 813 Hardwood Dr
- 704 Shenandoah River Dr Unit C
- 709 Fern Quay
- 208 Fireweed Ct
- 106 Fireweed Ct
- 810 Needlerush Ct
- 714 Willow Green Ct
- 700 Rapidan River Ct Unit E
- 700 Rapidan River Ct Unit D
- 1918 Willow Point Arch
- 1818 Willow Point Arch
- 728 Inlet Quay Unit C
- 728 Inlet Quay Unit 728
- 728 Inlet Quay
- 728 Inlet Quay
- 728 Inlet Quay
- 728 Inlet Quay
- 728 Inlet Quay
- 728 Inlet Quay
- 728 Inlet Quay
- 728 Inlet Quay
- 728 Inlet Quay
- 728 Inlet Quay
- 728 Inlet Quay Unit E
- 728 Inlet Quay Unit D
- 728 Inlet Quay Unit H
- 728 Inlet Quay Unit F
- 728 Inlet Quay Unit J
- 728 Inlet Quay Unit G
- 728 Inlet Quay Unit A
- 728-D Inlet Quay