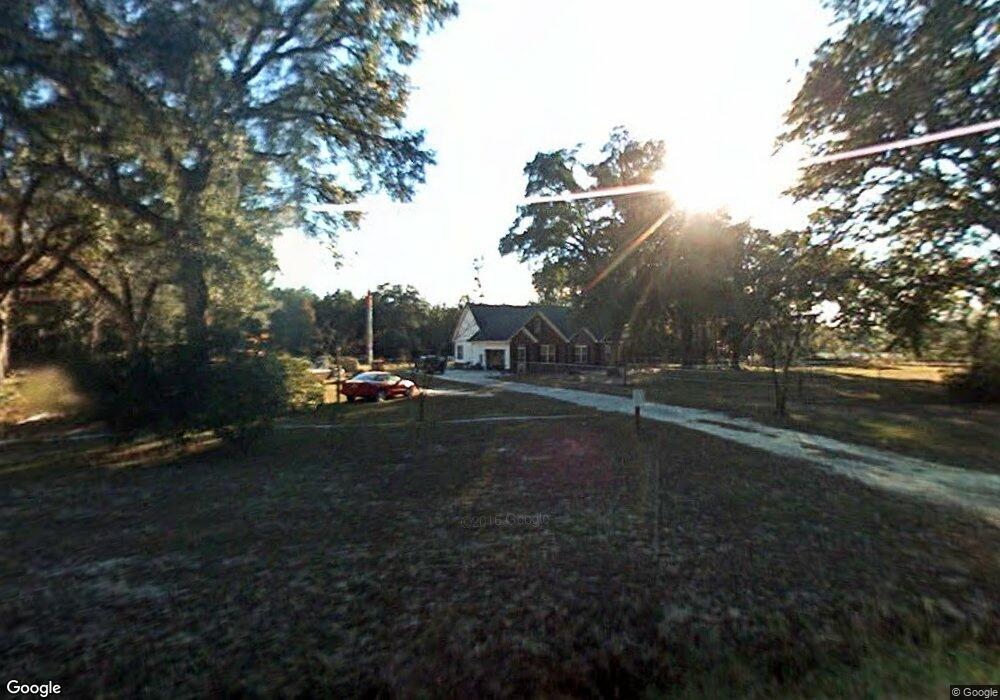
728 McElveen Kendrick Pond Rd Brooklet, GA 30415
Estimated Value: $347,000 - $463,000
3
Beds
2
Baths
2,251
Sq Ft
$184/Sq Ft
Est. Value
About This Home
This home is located at 728 McElveen Kendrick Pond Rd, Brooklet, GA 30415 and is currently estimated at $413,297, approximately $183 per square foot. 728 McElveen Kendrick Pond Rd is a home located in Bulloch County with nearby schools including Stilson Elementary School, Southeast Bulloch High School, and Southeast Bulloch Middle School.
Ownership History
Date
Name
Owned For
Owner Type
Purchase Details
Closed on
Apr 27, 2020
Sold by
Bowen Eric M
Bought by
Beasley Rusty R
Current Estimated Value
Home Financials for this Owner
Home Financials are based on the most recent Mortgage that was taken out on this home.
Original Mortgage
$231,725
Outstanding Balance
$205,610
Interest Rate
3.37%
Mortgage Type
FHA
Estimated Equity
$207,687
Purchase Details
Closed on
May 26, 2016
Sold by
Vivian Steven C
Bought by
Bowen Eric M
Home Financials for this Owner
Home Financials are based on the most recent Mortgage that was taken out on this home.
Original Mortgage
$184,891
Interest Rate
3.66%
Mortgage Type
VA
Purchase Details
Closed on
Mar 14, 2007
Sold by
Not Provided
Bought by
Vivian Steven C
Purchase Details
Closed on
Jun 29, 2004
Bought by
Vivian Steven C
Purchase Details
Closed on
Mar 1, 1987
Bought by
Saulgozis Alfred
Create a Home Valuation Report for This Property
The Home Valuation Report is an in-depth analysis detailing your home's value as well as a comparison with similar homes in the area
Home Values in the Area
Average Home Value in this Area
Purchase History
| Date | Buyer | Sale Price | Title Company |
|---|---|---|---|
| Beasley Rusty R | $236,000 | -- | |
| Bowen Eric M | $181,000 | -- | |
| Vivian Steven C | -- | -- | |
| Vivian Steven C | -- | -- | |
| Saulgozis Alfred | -- | -- |
Source: Public Records
Mortgage History
| Date | Status | Borrower | Loan Amount |
|---|---|---|---|
| Open | Beasley Rusty R | $231,725 | |
| Previous Owner | Bowen Eric M | $184,891 |
Source: Public Records
Tax History Compared to Growth
Tax History
| Year | Tax Paid | Tax Assessment Tax Assessment Total Assessment is a certain percentage of the fair market value that is determined by local assessors to be the total taxable value of land and additions on the property. | Land | Improvement |
|---|---|---|---|---|
| 2024 | $2,907 | $130,480 | $24,960 | $105,520 |
| 2023 | $2,717 | $111,680 | $16,320 | $95,360 |
| 2022 | $2,068 | $95,807 | $13,632 | $82,175 |
| 2021 | $1,858 | $83,942 | $13,632 | $70,310 |
| 2020 | $1,788 | $78,675 | $11,360 | $67,315 |
| 2019 | $1,800 | $78,788 | $11,360 | $67,428 |
| 2018 | $1,685 | $74,976 | $9,466 | $65,510 |
| 2017 | $1,648 | $73,147 | $9,466 | $63,681 |
| 2016 | $1,662 | $71,215 | $9,498 | $61,717 |
| 2015 | $1,636 | $69,756 | $9,498 | $60,258 |
| 2014 | $1,507 | $69,756 | $9,498 | $60,258 |
Source: Public Records
Map
Nearby Homes
- 787 Woodyard Rd
- 53 Jericho Ln
- 0 Highway 67 Unit 20148625
- 2335 Railroad Bed Rd
- 231 & 233 Firefly Ln
- 236 & 238 Firefly Ln
- 224 & 226 Firefly Ln
- 225 & 227 Firefly Ln
- 230 & 232 Firefly Ln
- 237 & 239 Firefly Ln
- 548 Sand Hill Rd
- 2101 Hendrix Rd
- 120 Bluff Oak Dr
- 317 Warrenton Place
- 408 Quarter Hole Ct
- 925 Cleary Rd
- 552 Sherrod Rd
- 4342 Mud Rd
- 4031 Mud Rd
- 0 Buie Driggers Rd Unit 10639920
- 706 McElveen Kendrick Pond Rd
- 816 McElveen Kendrick Pond Rd
- 701 McElveen Kendrick Pond Rd
- 635 McElveen Kendrick Pond Rd
- 645 McElveen Kendrick Pond Rd
- 899 McElveen Kendrick Pond Rd
- 947 McElveen Kendrick Pond Rd
- 992 McElveen Kendrick Pond Rd
- 995 Woodyard Rd
- 1156 Woodyard Rd
- 259 McElveen Kendrick Pond Rd
- 1128 Woodyard Rd
- 1253 Woodyard Rd
- 1281 Woodyard Rd
- 303 Canopy Ct
- 303 Canopy Ct Unit Lot 40
- 1220 Woodyard Rd
- 1174 Woodyard Rd
- 1315 Woodyard Rd
- 1315 Woodyard Rd