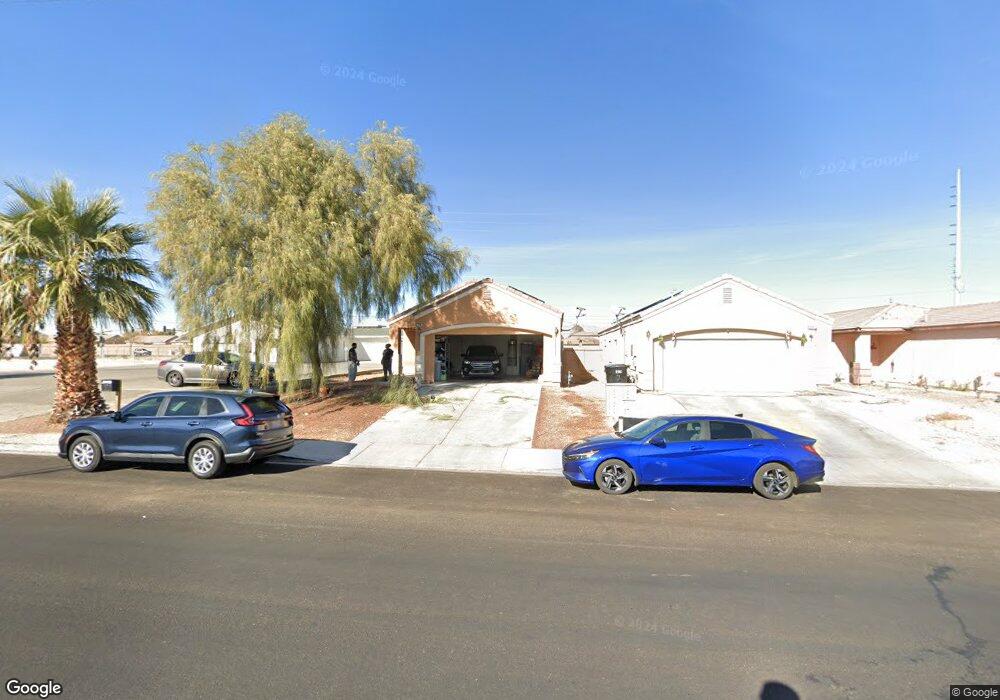
728 Miller Ave North Las Vegas, NV 89030
Downtown North Las Vegas NeighborhoodEstimated Value: $275,000 - $356,515
3
Beds
2
Baths
1,406
Sq Ft
$228/Sq Ft
Est. Value
About This Home
This home is located at 728 Miller Ave, North Las Vegas, NV 89030 and is currently estimated at $320,629, approximately $228 per square foot. 728 Miller Ave is a home located in Clark County with nearby schools including H.P. Fitzgerald Elementary School, West Prepatory Academy At Charlles I West Hall Sec, and Canyon Springs High School And The Leadership And.
Ownership History
Date
Name
Owned For
Owner Type
Purchase Details
Closed on
Feb 14, 2014
Sold by
Burch Bobby L and Griffith Burch Darlene
Bought by
Griffith Burch Darlene
Current Estimated Value
Home Financials for this Owner
Home Financials are based on the most recent Mortgage that was taken out on this home.
Original Mortgage
$121,500
Outstanding Balance
$91,256
Interest Rate
4.18%
Mortgage Type
New Conventional
Estimated Equity
$229,373
Purchase Details
Closed on
Sep 29, 2005
Sold by
Holy Trinity Community Development Corp
Bought by
Burch Bobby L and Burch Darlene Griffith
Home Financials for this Owner
Home Financials are based on the most recent Mortgage that was taken out on this home.
Original Mortgage
$147,000
Interest Rate
6.19%
Mortgage Type
Fannie Mae Freddie Mac
Create a Home Valuation Report for This Property
The Home Valuation Report is an in-depth analysis detailing your home's value as well as a comparison with similar homes in the area
Home Values in the Area
Average Home Value in this Area
Purchase History
| Date | Buyer | Sale Price | Title Company |
|---|---|---|---|
| Griffith Burch Darlene | -- | Title Source Inc | |
| Burch Bobby L | $175,000 | Ticor Title Of Nevada Inc |
Source: Public Records
Mortgage History
| Date | Status | Borrower | Loan Amount |
|---|---|---|---|
| Open | Griffith Burch Darlene | $121,500 | |
| Previous Owner | Burch Bobby L | $147,000 |
Source: Public Records
Tax History Compared to Growth
Tax History
| Year | Tax Paid | Tax Assessment Tax Assessment Total Assessment is a certain percentage of the fair market value that is determined by local assessors to be the total taxable value of land and additions on the property. | Land | Improvement |
|---|---|---|---|---|
| 2025 | $836 | $93,362 | $24,500 | $68,862 |
| 2024 | $812 | $93,362 | $24,500 | $68,862 |
| 2023 | $812 | $88,043 | $23,100 | $64,943 |
| 2022 | $789 | $74,845 | $15,750 | $59,095 |
| 2021 | $766 | $68,406 | $12,250 | $56,156 |
| 2020 | $740 | $64,337 | $8,750 | $55,587 |
| 2019 | $731 | $55,510 | $6,300 | $49,210 |
| 2018 | $698 | $50,240 | $5,600 | $44,640 |
| 2017 | $1,566 | $46,673 | $5,250 | $41,423 |
| 2016 | $655 | $45,615 | $4,200 | $41,415 |
| 2015 | $652 | $34,015 | $2,625 | $31,390 |
| 2014 | $633 | $18,308 | $2,625 | $15,683 |
Source: Public Records
Map
Nearby Homes
- 725 Miller Ave
- 2232 Matheson St
- 0 Miller Steet
- 0 Miller Streeet
- 0 Miller Ave
- 624 Desert Senna Ave
- 700 van Ert Ave
- 844 Balzar Ave
- 2130 Revere St
- 729 van Ert Ave
- 2419 Country Orchard St
- 621 van Ert Ave
- 421 Miller Ave
- 952 Balzar Ave
- 1105 Boylston Ave
- 2408 Copperbelt St
- 1120 Boylston Ave
- 1108 Boylston Ave
- 2405 Copperbelt St
- 1112 Boylston Ave
- 724 Miller Ave
- 720 Miller Ave
- 716 Miller Ave
- 712 Miller Ave
- 721 Miller Ave
- 729 Miller Ave
- 708 Miller Ave
- 717 Miller Ave
- 733 Miller Ave
- 704 Miller Ave
- 715 Miller Ave
- 2312 Revere St
- 668 Miller Ave
- 724 Veronica Ave
- 728 Veronica Ave
- 720 Veronica Ave
- 709 Miller Ave
- 2308 Revere St
- 712 Veronica Ave
- 800 Miller Ave