Estimated Value: $141,000 - $208,000
3
Beds
2
Baths
1,467
Sq Ft
$117/Sq Ft
Est. Value
About This Home
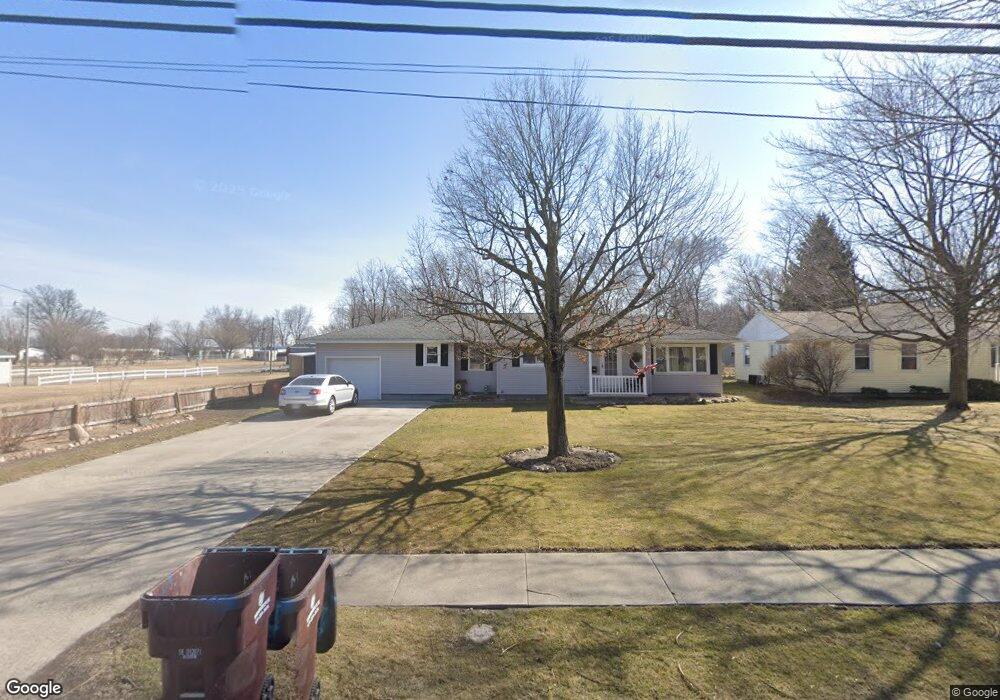
This home is located at 728 N Main St, Ada, OH 45810 and is currently estimated at $171,949, approximately $117 per square foot. 728 N Main St is a home located in Hardin County with nearby schools including Ada Elementary School and Ada High School.
Ownership History
Date
Name
Owned For
Owner Type
Purchase Details
Closed on
Apr 15, 2011
Sold by
Mcbride Anabel R
Bought by
Cogar Delbert R and Cogar Annette Sue
Current Estimated Value
Purchase Details
Closed on
Oct 24, 2009
Sold by
Mcbride Anabel R
Bought by
Mcbride Anabel R and Cogar Annette Sue
Home Financials for this Owner
Home Financials are based on the most recent Mortgage that was taken out on this home.
Original Mortgage
$55,200
Interest Rate
5.1%
Mortgage Type
New Conventional
Purchase Details
Closed on
Oct 21, 2009
Sold by
Snavely Robert J
Bought by
Mcbride Anabel R
Home Financials for this Owner
Home Financials are based on the most recent Mortgage that was taken out on this home.
Original Mortgage
$55,200
Interest Rate
5.1%
Mortgage Type
New Conventional
Purchase Details
Closed on
Jun 22, 1993
Bought by
Snavely Robert J and Snavely Shirl
Create a Home Valuation Report for This Property
The Home Valuation Report is an in-depth analysis detailing your home's value as well as a comparison with similar homes in the area
Home Values in the Area
Average Home Value in this Area
Purchase History
| Date | Buyer | Sale Price | Title Company |
|---|---|---|---|
| Cogar Delbert R | -- | None Available | |
| Mcbride Anabel R | -- | None Available | |
| Mcbride Anabel R | $69,000 | None Available | |
| Snavely Robert J | -- | -- |
Source: Public Records
Mortgage History
| Date | Status | Borrower | Loan Amount |
|---|---|---|---|
| Previous Owner | Mcbride Anabel R | $55,200 |
Source: Public Records
Tax History Compared to Growth
Tax History
| Year | Tax Paid | Tax Assessment Tax Assessment Total Assessment is a certain percentage of the fair market value that is determined by local assessors to be the total taxable value of land and additions on the property. | Land | Improvement |
|---|---|---|---|---|
| 2024 | $1,664 | $42,900 | $3,980 | $38,920 |
| 2023 | $1,664 | $42,900 | $3,980 | $38,920 |
| 2022 | $1,654 | $37,260 | $3,850 | $33,410 |
| 2021 | $1,815 | $37,260 | $3,850 | $33,410 |
| 2020 | $1,839 | $37,260 | $3,850 | $33,410 |
| 2019 | $1,630 | $33,370 | $3,670 | $29,700 |
| 2018 | $1,594 | $33,370 | $3,670 | $29,700 |
| 2017 | $1,367 | $33,370 | $3,670 | $29,700 |
| 2016 | $1,150 | $25,810 | $3,530 | $22,280 |
| 2015 | $1,099 | $25,810 | $3,530 | $22,280 |
| 2014 | $1,121 | $25,810 | $3,530 | $22,280 |
| 2013 | $864 | $27,130 | $3,530 | $23,600 |
Source: Public Records
Map
Nearby Homes
- 629 N Main St
- 128 W North Ave
- 444 Edwards St Unit A, B
- 444 Edwards St Unit 2
- 442 Edwards St
- 210 N Gilbert St
- 211 S Main St
- 118 W Buckeye Ave
- 212 N Simon St
- 211 W Buckeye Ave Unit 211 1/2
- 301 S Main St
- 308-310 S Simon St
- 314 E University Ave
- 710 S Main St
- 4071 Township Road 35
- 2864 Ohio 309
- 3769 County Road 304
- 3931 County Road 80
- 22694 County Road 12
- 900 N Front St