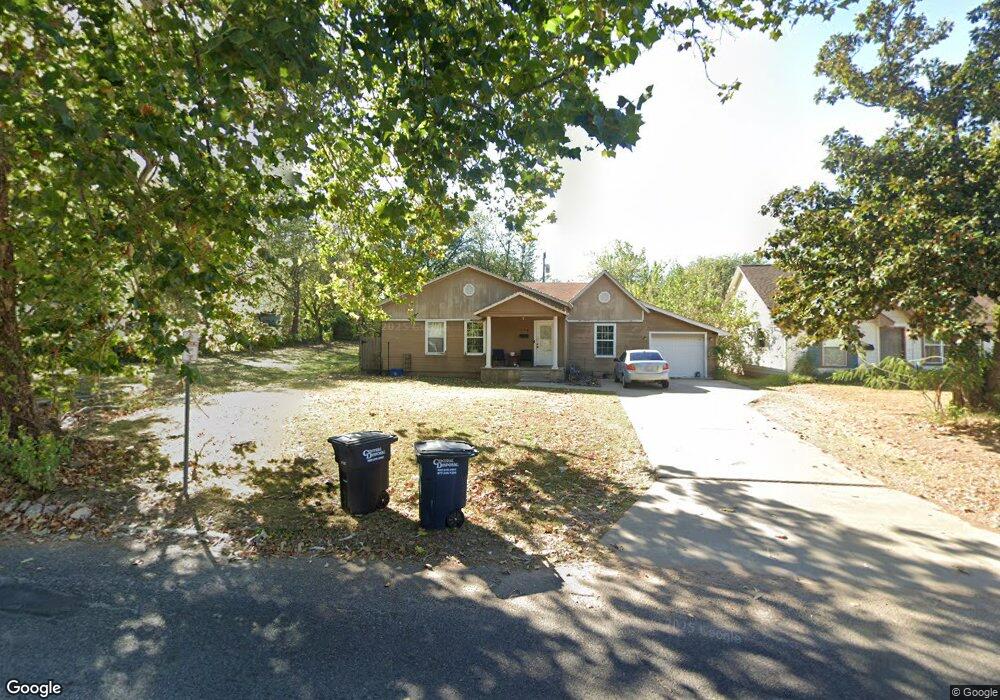
728 N Union Ave Shawnee, OK 74801
Estimated Value: $88,000 - $159,000
3
Beds
1
Bath
1,459
Sq Ft
$84/Sq Ft
Est. Value
About This Home
This home is located at 728 N Union Ave, Shawnee, OK 74801 and is currently estimated at $122,916, approximately $84 per square foot. 728 N Union Ave is a home located in Pottawatomie County with nearby schools including Sequoyah Elementary School, Shawnee Middle School, and Shawnee High School.
Ownership History
Date
Name
Owned For
Owner Type
Purchase Details
Closed on
Apr 27, 2007
Sold by
Matthews Jerry F and Matthews Deanna S
Bought by
Cortez Adolfo Cruz and Cruz Anette
Current Estimated Value
Home Financials for this Owner
Home Financials are based on the most recent Mortgage that was taken out on this home.
Original Mortgage
$63,787
Outstanding Balance
$38,715
Interest Rate
6.13%
Mortgage Type
Unknown
Estimated Equity
$84,201
Purchase Details
Closed on
Mar 7, 2006
Sold by
Pottawatomie County Treasurer
Bought by
Matthews Jerry F
Purchase Details
Closed on
Mar 10, 2005
Sold by
Bolling Michael D and Bolling Margaret S
Bought by
Matthews Jerry F and Matthews Deanna S
Purchase Details
Closed on
Jul 14, 1998
Sold by
Matthews Jerry
Bought by
Bolling Michael and Bolling Margare
Purchase Details
Closed on
Nov 4, 1997
Sold by
Fish James and Fish Kelly
Bought by
Matthews Jerry
Create a Home Valuation Report for This Property
The Home Valuation Report is an in-depth analysis detailing your home's value as well as a comparison with similar homes in the area
Home Values in the Area
Average Home Value in this Area
Purchase History
| Date | Buyer | Sale Price | Title Company |
|---|---|---|---|
| Cortez Adolfo Cruz | $63,000 | None Available | |
| Matthews Jerry F | -- | None Available | |
| Matthews Jerry F | -- | None Available | |
| Bolling Michael | $21,500 | -- | |
| Matthews Jerry | $5,000 | -- |
Source: Public Records
Mortgage History
| Date | Status | Borrower | Loan Amount |
|---|---|---|---|
| Open | Cortez Adolfo Cruz | $63,787 |
Source: Public Records
Tax History Compared to Growth
Tax History
| Year | Tax Paid | Tax Assessment Tax Assessment Total Assessment is a certain percentage of the fair market value that is determined by local assessors to be the total taxable value of land and additions on the property. | Land | Improvement |
|---|---|---|---|---|
| 2024 | $908 | $9,979 | $1,079 | $8,900 |
| 2023 | $908 | $9,689 | $1,071 | $8,618 |
| 2022 | $862 | $9,406 | $1,057 | $8,349 |
| 2021 | $819 | $9,407 | $1,079 | $8,328 |
| 2020 | $795 | $8,867 | $1,010 | $7,857 |
| 2019 | $794 | $8,608 | $950 | $7,658 |
| 2018 | $753 | $8,358 | $916 | $7,442 |
| 2017 | $718 | $8,114 | $867 | $7,247 |
| 2016 | $702 | $7,878 | $828 | $7,050 |
| 2015 | $665 | $7,649 | $793 | $6,856 |
| 2014 | $643 | $7,427 | $740 | $6,687 |
Source: Public Records
Map
Nearby Homes
- 434 E Wallace St
- 717 N Broadway Ave
- 727 N Beard Ave
- 1003 N Minnesota Ave
- 1017 N Bdwy Ave
- 735 N Park Ave
- 128 W Ridgewood St
- 317 W Dill St
- 320 W Dill St
- 615 N Park Ave
- 1006 N Market Ave
- 730 N Tucker Ave
- 318 W Dill St
- 710 N Tucker Ave
- 000 N Mckinley Ave
- 426 N Beard Ave
- 907 N Mckinley Ave
- 627 N Tucker Ave
- 634 N Louisa Ave
- 509 N Park Ave
- 726 N Union Ave
- 732 N Union Ave
- 718 N Union Ave
- 721 N Union Ave
- 725 Hobson St
- 723 Hobson St
- 727 Hobson St
- 721 Hobson St
- 735 Hobson St
- 717 N Union Ave
- 715 N Union Ave
- 715 Hobson St
- 713 N Union Ave
- 802 N Union Ave
- 114 E Wallace St
- 711 N Union Ave
- 711 Hobson St
- 710 N Union Ave
- 801 Hobson St
- 709 Hobson St